\n
## Chart: Correctness vs. Number of Retries
### Overview
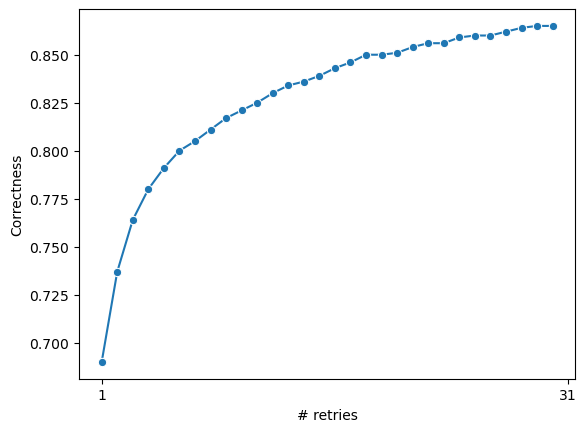
The image presents a line chart illustrating the relationship between the number of retries and the resulting correctness. The chart shows a clear upward trend, indicating that correctness increases with the number of retries, but with diminishing returns as the number of retries increases.
### Components/Axes
* **X-axis Label:** "# retries" - Represents the number of attempts or retries. The scale ranges from approximately 1 to 31.
* **Y-axis Label:** "Correctness" - Represents the accuracy or correctness of a process or result. The scale ranges from approximately 0.69 to 0.87.
* **Data Series:** A single blue line with circular data points.
* **No Legend:** There is no explicit legend, but the single line represents the relationship between the two variables.
### Detailed Analysis
The line representing correctness starts at a value of approximately 0.695 when the number of retries is 1. The line then exhibits a steep upward slope, rapidly increasing correctness as the number of retries increases.
Here's a breakdown of approximate data points:
* **Retry = 1:** Correctness ≈ 0.695
* **Retry = 2:** Correctness ≈ 0.725
* **Retry = 3:** Correctness ≈ 0.755
* **Retry = 4:** Correctness ≈ 0.775
* **Retry = 5:** Correctness ≈ 0.790
* **Retry = 6:** Correctness ≈ 0.800
* **Retry = 8:** Correctness ≈ 0.815
* **Retry = 10:** Correctness ≈ 0.825
* **Retry = 12:** Correctness ≈ 0.835
* **Retry = 14:** Correctness ≈ 0.840
* **Retry = 16:** Correctness ≈ 0.845
* **Retry = 18:** Correctness ≈ 0.850
* **Retry = 20:** Correctness ≈ 0.853
* **Retry = 22:** Correctness ≈ 0.855
* **Retry = 24:** Correctness ≈ 0.857
* **Retry = 26:** Correctness ≈ 0.858
* **Retry = 28:** Correctness ≈ 0.860
* **Retry = 31:** Correctness ≈ 0.862
The slope of the line decreases as the number of retries increases. The increase in correctness becomes smaller with each additional retry, suggesting diminishing returns. The line appears to be approaching an asymptote, indicating that further retries will yield only marginal improvements in correctness.
### Key Observations
* The initial increase in correctness with retries is substantial.
* The rate of improvement in correctness decreases significantly after approximately 16 retries.
* The correctness appears to plateau around a value of 0.86.
* There are no apparent outliers or anomalies in the data.
### Interpretation
The chart demonstrates the concept of diminishing returns in a process that involves retries. Initially, each retry significantly improves the correctness of the outcome. However, as the number of retries increases, the marginal benefit of each additional retry decreases. This suggests that there is an optimal number of retries beyond which further attempts are unlikely to yield substantial improvements.
This type of data could represent a variety of scenarios, such as:
* **Error Correction:** The number of attempts to correct an error in a system.
* **Machine Learning Training:** The number of training iterations to improve model accuracy.
* **Iterative Problem Solving:** The number of attempts to solve a problem through trial and error.
The chart highlights the importance of balancing the cost of retries with the potential benefits in terms of improved correctness. It suggests that a strategy of limiting the number of retries to a point where the marginal benefit is low could be more efficient than continuing to retry indefinitely.