# Technical Document Extraction: Llama 7B Performance Analysis
## 1. Header Information
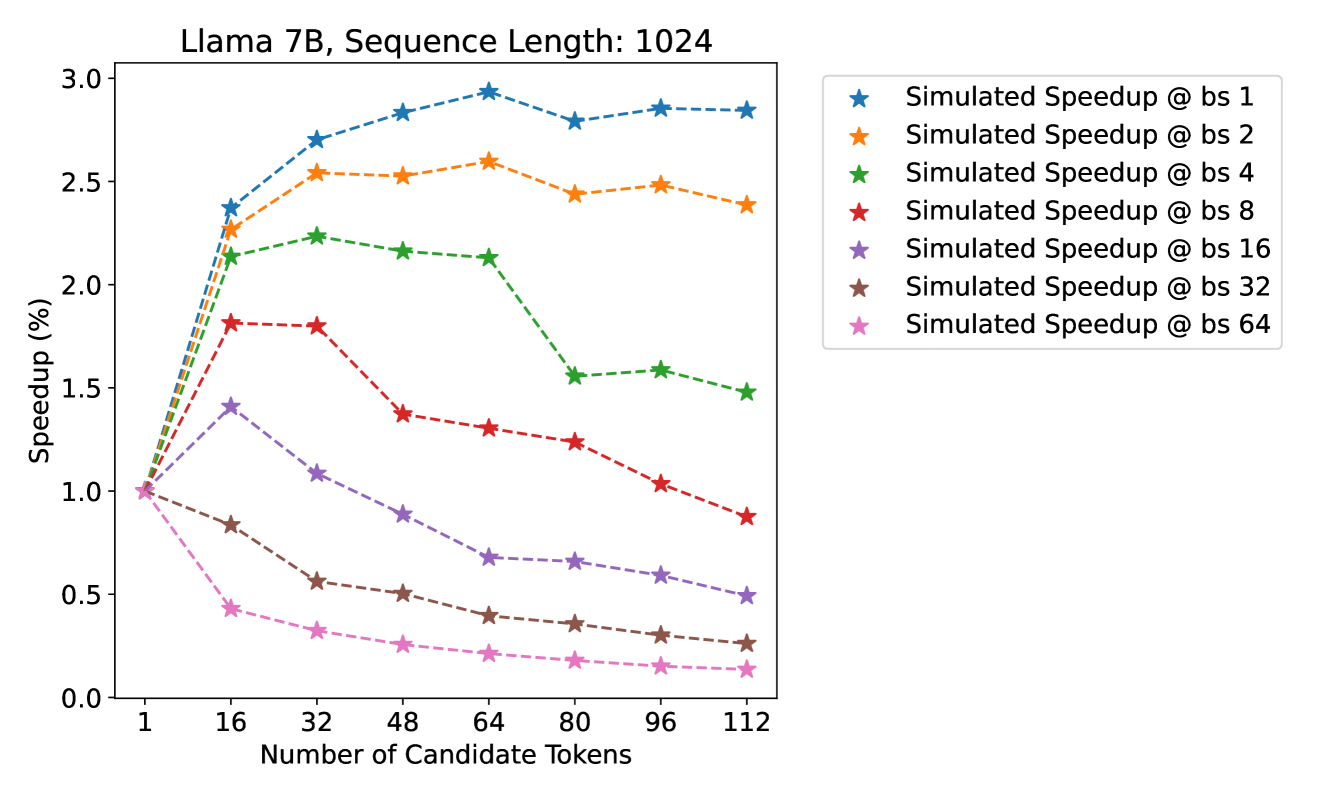
* **Title:** Llama 7B, Sequence Length: 1024
* **Primary Subject:** Simulated Speedup performance relative to the number of candidate tokens across various batch sizes (bs).
## 2. Chart Metadata and Axes
* **Chart Type:** Multi-series line graph with markers.
* **X-Axis Label:** Number of Candidate Tokens
* **Markers:** 1, 16, 32, 48, 64, 80, 96, 112
* **Y-Axis Label:** Speedup (%)
* **Range:** 0.0 to 3.0
* **Markers:** 0.0, 0.5, 1.0, 1.5, 2.0, 2.5, 3.0
* **Legend Location:** Right-hand side, external to the main plot area.
* **Legend Content:**
* ★ (Blue): Simulated Speedup @ bs 1
* ★ (Orange): Simulated Speedup @ bs 2
* ★ (Green): Simulated Speedup @ bs 4
* ★ (Red): Simulated Speedup @ bs 8
* ★ (Purple): Simulated Speedup @ bs 16
* ★ (Brown): Simulated Speedup @ bs 32
* ★ (Pink): Simulated Speedup @ bs 64
---
## 3. Data Series Analysis and Trends
All series originate at a Speedup of **1.0** when the Number of Candidate Tokens is **1**.
### Series 1: Simulated Speedup @ bs 1 (Blue Line)
* **Trend:** Sharp upward slope initially, peaking at 64 tokens, followed by a slight plateau/minor fluctuation.
* **Key Data Points (Approximate):**
* 16 tokens: ~2.35
* 64 tokens: ~2.95 (Peak)
* 112 tokens: ~2.85
### Series 2: Simulated Speedup @ bs 2 (Orange Line)
* **Trend:** Strong upward slope, peaking at 64 tokens, then a slight decline and stabilization.
* **Key Data Points (Approximate):**
* 16 tokens: ~2.25
* 64 tokens: ~2.60 (Peak)
* 112 tokens: ~2.40
### Series 3: Simulated Speedup @ bs 4 (Green Line)
* **Trend:** Upward slope peaking early at 32 tokens, maintaining a plateau until 64, then a significant drop at 80 tokens.
* **Key Data Points (Approximate):**
* 32 tokens: ~2.25 (Peak)
* 64 tokens: ~2.15
* 80 tokens: ~1.55
* 112 tokens: ~1.50
### Series 4: Simulated Speedup @ bs 8 (Red Line)
* **Trend:** Initial increase peaking at 16-32 tokens, followed by a steady downward slope as candidate tokens increase.
* **Key Data Points (Approximate):**
* 16 tokens: ~1.80 (Peak)
* 32 tokens: ~1.80
* 64 tokens: ~1.30
* 112 tokens: ~0.90 (Drops below baseline)
### Series 5: Simulated Speedup @ bs 16 (Purple Line)
* **Trend:** Slight initial increase peaking at 16 tokens, followed by a consistent downward trend.
* **Key Data Points (Approximate):**
* 16 tokens: ~1.40 (Peak)
* 64 tokens: ~0.70
* 112 tokens: ~0.50
### Series 6: Simulated Speedup @ bs 32 (Brown Line)
* **Trend:** Immediate and continuous downward slope from the baseline.
* **Key Data Points (Approximate):**
* 16 tokens: ~0.85
* 64 tokens: ~0.40
* 112 tokens: ~0.25
### Series 7: Simulated Speedup @ bs 64 (Pink Line)
* **Trend:** Sharp immediate downward slope, representing the lowest performance across all configurations.
* **Key Data Points (Approximate):**
* 16 tokens: ~0.45
* 64 tokens: ~0.20
* 112 tokens: ~0.15
---
## 4. Component Isolation & Summary
* **Header:** Defines the model (Llama 7B) and context (1024 sequence length).
* **Main Chart:** Visualizes the inverse relationship between batch size and speedup efficiency as candidate tokens increase.
* **Key Observation:** Lower batch sizes (bs 1, 2, 4) benefit significantly from increasing candidate tokens, achieving up to ~3x speedup. Conversely, higher batch sizes (bs 16, 32, 64) see a performance degradation (speedup < 1.0) as the number of candidate tokens increases, suggesting overhead costs outweigh the benefits of speculative execution at high concurrency.