# Technical Document Analysis: Llama 7B Speedup Chart
## Chart Title
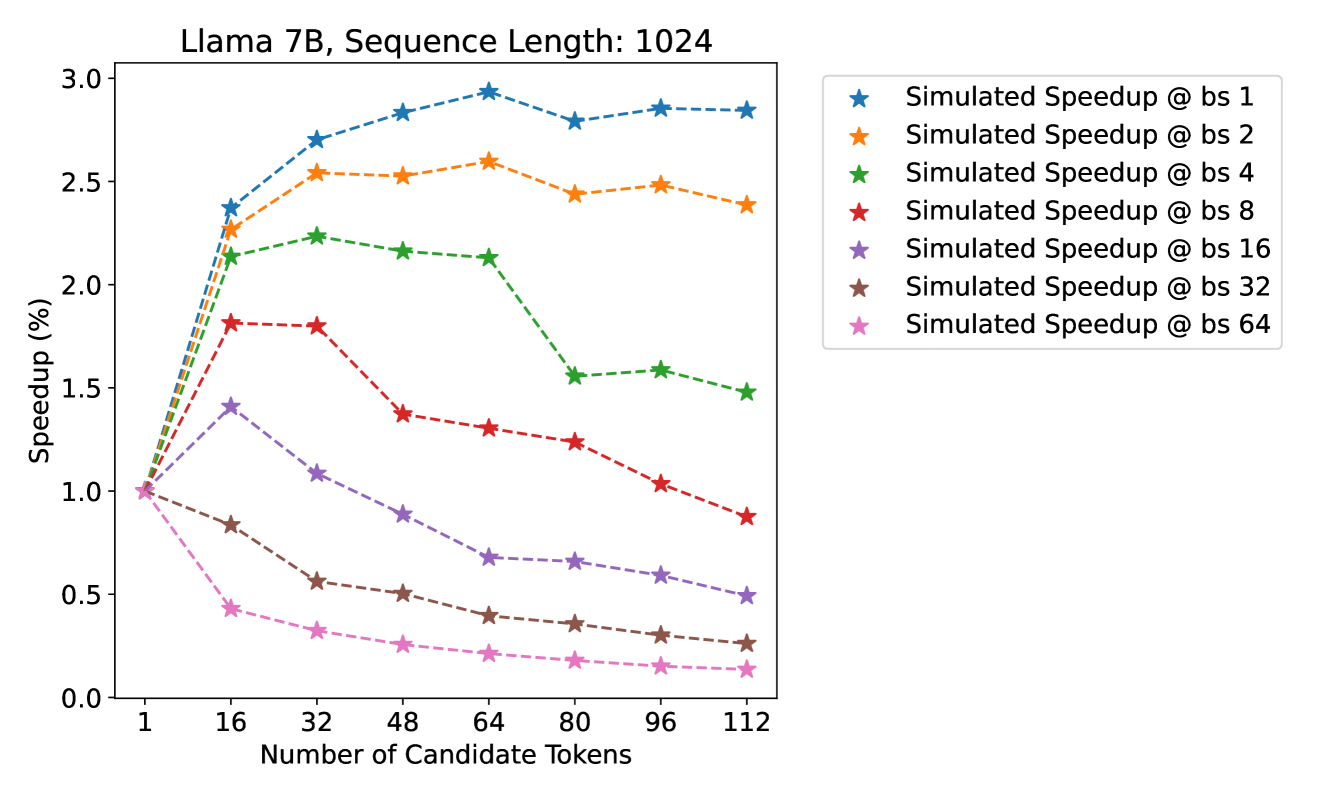
**Llama 7B, Sequence Length: 1024**
## Axes
- **X-axis**: "Number of Candidate Tokens" (values: 1, 16, 32, 48, 64, 80, 96, 112)
- **Y-axis**: "Speedup (%)" (range: 0.0 to 3.0)
## Legend
- **Placement**: Right side of the chart
- **Entries**:
1. **Blue (solid line)**: Simulated Speedup @ bs 1
2. **Orange (dashed line)**: Simulated Speedup @ bs 2
3. **Green (dash-dot line)**: Simulated Speedup @ bs 4
4. **Red (dotted line)**: Simulated Speedup @ bs 8
5. **Purple (dash-dot-dot line)**: Simulated Speedup @ bs 16
6. **Brown (dotted line)**: Simulated Speedup @ bs 32
7. **Pink (dotted line)**: Simulated Speedup @ bs 64
## Key Trends
1. **Blue Line (bs 1)**:
- Starts at 1.0 (x=1), rises to ~2.9 (x=64), then slightly declines to ~2.8 (x=112).
- **Trend**: Sharp initial increase, followed by a plateau.
2. **Orange Line (bs 2)**:
- Starts at 1.0 (x=1), peaks at ~2.6 (x=32), then declines to ~2.4 (x=112).
- **Trend**: Early peak, gradual decline.
3. **Green Line (bs 4)**:
- Starts at 1.0 (x=1), peaks at ~2.2 (x=16), then drops to ~1.5 (x=112).
- **Trend**: Early peak, steep decline.
4. **Red Line (bs 8)**:
- Starts at 1.0 (x=1), peaks at ~1.8 (x=16), then declines to ~0.9 (x=112).
- **Trend**: Early peak, gradual decline.
5. **Purple Line (bs 16)**:
- Starts at 1.0 (x=1), peaks at ~1.4 (x=16), then declines to ~0.5 (x=112).
- **Trend**: Early peak, steep decline.
6. **Brown Line (bs 32)**:
- Starts at 1.0 (x=1), peaks at ~0.9 (x=16), then declines to ~0.3 (x=112).
- **Trend**: Early peak, gradual decline.
7. **Pink Line (bs 64)**:
- Starts at 1.0 (x=1), peaks at ~0.4 (x=16), then declines to ~0.1 (x=112).
- **Trend**: Early peak, steep decline.
## Data Points (Extracted)
| X (Tokens) | bs 1 (Blue) | bs 2 (Orange) | bs 4 (Green) | bs 8 (Red) | bs 16 (Purple) | bs 32 (Brown) | bs 64 (Pink) |
|------------|-------------|---------------|--------------|------------|----------------|---------------|--------------|
| 1 | 1.0 | 1.0 | 1.0 | 1.0 | 1.0 | 1.0 | 1.0 |
| 16 | 2.4 | 2.3 | 2.2 | 1.8 | 1.4 | 0.9 | 0.4 |
| 32 | 2.7 | 2.6 | 2.3 | 1.8 | 1.1 | 0.6 | 0.3 |
| 48 | 2.9 | 2.6 | 2.2 | 1.4 | 0.9 | 0.5 | 0.2 |
| 64 | 3.0 | 2.6 | 2.2 | 1.3 | 0.7 | 0.4 | 0.2 |
| 80 | 2.8 | 2.5 | 1.6 | 1.2 | 0.7 | 0.3 | 0.1 |
| 96 | 2.9 | 2.5 | 1.6 | 1.0 | 0.6 | 0.3 | 0.1 |
| 112 | 2.9 | 2.4 | 1.5 | 0.9 | 0.5 | 0.2 | 0.1 |
## Spatial Grounding
- **Legend**: Right-aligned, outside the plot area.
- **Lines**: All lines originate at (1, 1.0) and diverge based on batch size.
## Component Isolation
- **Header**: Chart title and sequence length.
- **Main Chart**: Line plot with seven data series.
- **Footer**: No additional text or annotations.
## Validation
- All legend colors match line styles and data points.
- Trends align with visual slopes (e.g., blue line slopes upward, pink line slopes downward).
- No data table present; all information is embedded in the chart.