TECHNICAL ASSET FINGERPRINT
5280a812eef8527de6e555fe
Click to view fullscreen
Press ESC or click to close
FOUND IN PAPERS
EXPERT: gemini-2.0-flash VERSION 1
RUNTIME: nugit/gemini/gemini-2.0-flash
INTEL_VERIFIED
## Line Chart: Accuracy vs. Training Sequence Per Task
### Overview
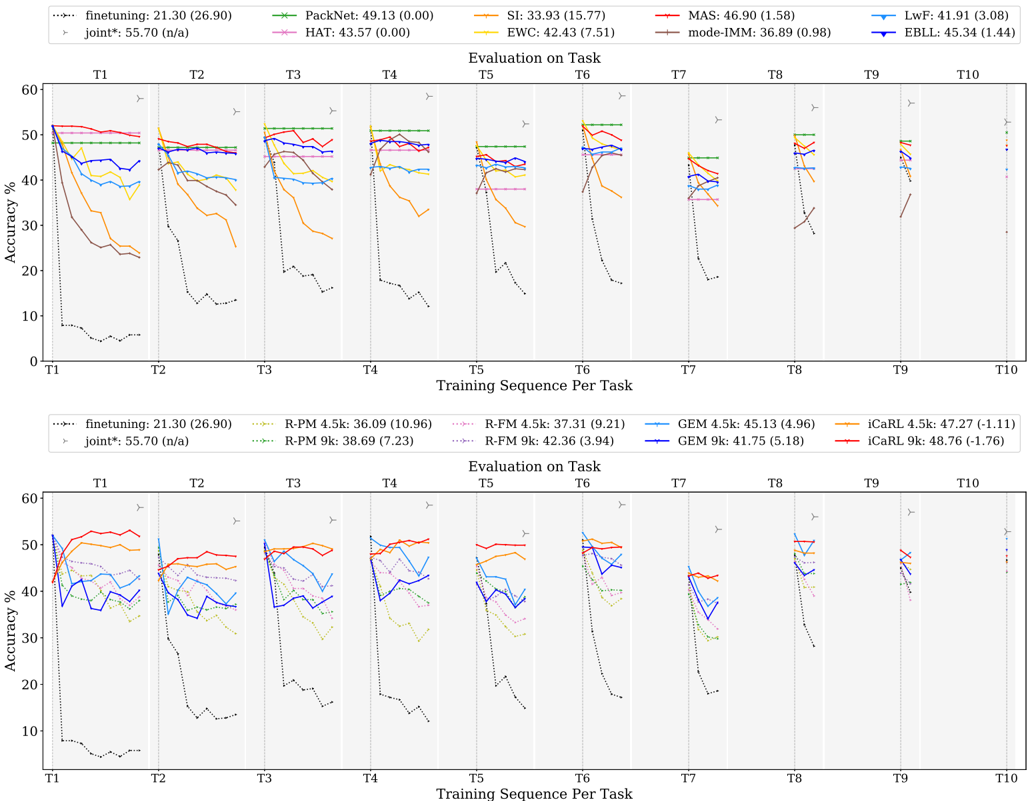
The image contains two line charts comparing the accuracy of different machine learning models across a sequence of tasks (T1 to T10). The charts display the performance of various continual learning algorithms, with accuracy plotted against the training sequence per task. The top chart focuses on algorithms like Finetuning, PackNet, HAT, SI, EWC, MAS, mode-IMM, LwF, and EBLL. The bottom chart focuses on Finetuning, R-PM, R-FM, GEM, and iCaRL variants.
### Components/Axes
* **Y-axis (Accuracy %):** Ranges from 0 to 60, with tick marks at intervals of 10.
* **X-axis (Training Sequence Per Task):** Represents the sequence of tasks from T1 to T10. Each task is separated by a vertical dashed line.
* **Title (Top Chart):** Evaluation on Task
* **Title (Bottom Chart):** Evaluation on Task
* **Legend (Top Chart, top-right):**
* `finetuning`: 21.30 (26.90) - Dotted Black Line
* `joint*`: 55.70 (n/a) - Gray Line with Triangle Markers
* `PackNet`: 49.13 (0.00) - Green Line with X Markers
* `HAT`: 43.57 (0.00) - Pink Line with Star Markers
* `SI`: 33.93 (15.77) - Orange Line
* `EWC`: 42.43 (7.51) - Brown Line
* `MAS`: 46.90 (1.58) - Red Line
* `mode-IMM`: 36.89 (0.98) - Teal Line
* `LwF`: 41.91 (3.08) - Blue Line
* `EBLL`: 45.34 (1.44) - Dark Blue Line with Triangle Markers
* **Legend (Bottom Chart, bottom-center):**
* `finetuning`: 21.30 (26.90) - Dotted Black Line
* `joint*`: 55.70 (n/a) - Gray Line with Triangle Markers
* `R-PM 4.5k`: 36.09 (10.96) - Red Line with Plus Markers
* `R-PM 9k`: 38.69 (7.23) - Green Dotted Line with Plus Markers
* `R-FM 4.5k`: 37.31 (9.21) - Pink Dotted Line
* `R-FM 9k`: 42.36 (3.94) - Gray Dotted Line
* `GEM 4.5k`: 45.13 (4.96) - Light Blue Line
* `GEM 9k`: 41.75 (5.18) - Dark Blue Line
* `iCaRL 4.5k`: 47.27 (-1.11) - Yellow Line
* `iCaRL 9k`: 48.76 (-1.76) - Red Line
### Detailed Analysis
**Top Chart:**
* **Finetuning (Dotted Black Line):** Starts low (around 5% at T1) and remains consistently low across all tasks, indicating poor performance.
* **Joint\* (Gray Line with Triangle Markers):** Starts high (around 55% at T1) and remains relatively stable across all tasks.
* **PackNet (Green Line with X Markers):** Starts high (around 50% at T1) and remains relatively stable across all tasks.
* **HAT (Pink Line with Star Markers):** Starts around 50% at T1, decreases slightly, and then stabilizes.
* **SI (Orange Line):** Starts around 50% at T1, decreases significantly by T2, and then continues to decrease gradually.
* **EWC (Brown Line):** Starts around 40% at T1, decreases significantly by T2, and then continues to decrease gradually.
* **MAS (Red Line):** Starts around 50% at T1, decreases slightly, and then stabilizes.
* **mode-IMM (Teal Line):** Starts around 40% at T1, decreases slightly, and then stabilizes.
* **LwF (Blue Line):** Starts around 40% at T1, decreases slightly, and then stabilizes.
* **EBLL (Dark Blue Line with Triangle Markers):** Starts around 45% at T1, decreases slightly, and then stabilizes.
**Bottom Chart:**
* **Finetuning (Dotted Black Line):** Starts low (around 5% at T1) and remains consistently low across all tasks, indicating poor performance.
* **Joint\* (Gray Line with Triangle Markers):** Starts high (around 55% at T1) and remains relatively stable across all tasks.
* **R-PM 4.5k (Red Line with Plus Markers):** Starts around 50% at T1, decreases significantly by T2, and then continues to decrease gradually.
* **R-PM 9k (Green Dotted Line with Plus Markers):** Starts around 40% at T1, decreases significantly by T2, and then continues to decrease gradually.
* **R-FM 4.5k (Pink Dotted Line):** Starts around 45% at T1, decreases significantly by T2, and then continues to decrease gradually.
* **R-FM 9k (Gray Dotted Line):** Starts around 50% at T1, decreases significantly by T2, and then continues to decrease gradually.
* **GEM 4.5k (Light Blue Line):** Starts around 40% at T1, decreases slightly, and then stabilizes.
* **GEM 9k (Dark Blue Line):** Starts around 40% at T1, decreases slightly, and then stabilizes.
* **iCaRL 4.5k (Yellow Line):** Starts around 50% at T1, decreases slightly, and then stabilizes.
* **iCaRL 9k (Red Line):** Starts around 50% at T1, decreases slightly, and then stabilizes.
### Key Observations
* **Finetuning:** Consistently performs poorly across all tasks in both charts.
* **Joint\*:** Maintains high accuracy across all tasks in both charts.
* **Performance Drop:** Many algorithms experience a significant drop in accuracy between T1 and T2, indicating catastrophic forgetting.
* **Stabilization:** After the initial drop, most algorithms stabilize, suggesting they retain some knowledge from previous tasks.
* **Algorithm Comparison:** Algorithms like PackNet, HAT, MAS, EBLL, iCaRL, and GEM variants show relatively better performance compared to Finetuning, SI, EWC, and R-PM/R-FM variants.
### Interpretation
The charts illustrate the challenges of continual learning, where models struggle to maintain performance on previous tasks as they learn new ones. Finetuning, a naive approach, suffers significantly from catastrophic forgetting. Joint training (Joint\*) provides a strong baseline, demonstrating the performance achievable when all data is available at once. Algorithms like PackNet, HAT, MAS, EBLL, iCaRL, and GEM variants represent more sophisticated approaches to continual learning, mitigating catastrophic forgetting to varying degrees. The initial drop in accuracy between T1 and T2 highlights the difficulty of retaining knowledge from the first task when learning subsequent tasks. The subsequent stabilization suggests that these algorithms are partially successful in preserving previously learned information.
DECODING INTELLIGENCE...
EXPERT: gemini-3.1-flash-lite-preview-free VERSION 1
RUNTIME: google-free/gemini-3.1-flash-lite-preview
INTEL_VERIFIED
## Multi-panel Line Chart: Continual Learning Accuracy Evaluation
### Overview
The image consists of two stacked, multi-panel line charts (facet grids) evaluating the performance of various machine learning algorithms across a sequence of 10 tasks (T1 through T10). The charts visualize the phenomenon of "catastrophic forgetting," where models lose accuracy on previous tasks as they learn new ones. The Y-axis represents "Accuracy %" (0-60), and the X-axis represents the "Training Sequence Per Task" (T1-T10). Each facet represents the "Evaluation on Task" (T1-T10), showing how accuracy on a specific task evolves as the model trains on subsequent tasks.
### Components/Axes
* **Y-Axis:** "Accuracy %", ranging from 0 to 60.
* **X-Axis:** "Training Sequence Per Task", labeled T1 through T10.
* **Facets:** Each chart is divided into 10 vertical panels labeled T1 through T10 at the top, representing the task being evaluated.
* **Markers:** A small "Y" symbol appears at the top right of each facet, indicating the current task being trained.
* **Legends:** Located at the top of each chart, defining the color-coded lines and providing summary statistics (Average Accuracy and likely standard deviation/forgetting metric in parentheses).
---
### Detailed Analysis
#### Top Chart: Regularization and Architectural Methods
This chart compares methods that typically use regularization or architectural changes to prevent forgetting.
**Legend & Data Series:**
* **finetuning (Black dotted line):** Starts at ~50% at T1, but drops precipitously to <10% by T2/T3. Value: 21.30 (26.90).
* **joint* (Grey dotted line):** The upper-bound baseline. Remains consistently high across all tasks. Value: 55.70 (n/a).
* **PackNet (Green line, 'x' markers):** Extremely stable; maintains high accuracy across all tasks. Value: 49.13 (0.00).
* **HAT (Pink line, 'x' markers):** Very stable, slightly lower than PackNet. Value: 43.57 (0.00).
* **SI (Orange line):** Shows a significant downward trend as tasks progress. Value: 33.93 (15.77).
* **EWC (Yellow line):** Moderate stability, shows a downward slope. Value: 42.43 (7.51).
* **MAS (Red line):** Relatively stable, tracks near the top performers. Value: 46.90 (1.58).
* **mode-IMM (Brown line):** Shows a sharp decline similar to finetuning, though slightly better. Value: 36.89 (0.98).
* **LwF (Light blue line):** Moderate decline. Value: 41.91 (3.08).
* **EBLL (Dark blue line):** Moderate stability. Value: 45.34 (1.44).
#### Bottom Chart: Replay/Memory-Based Methods
This chart compares methods that utilize memory buffers (replay) of varying sizes (4.5k and 9k).
**Legend & Data Series:**
* **finetuning (Black dotted line):** Same baseline as above. Value: 21.30 (26.90).
* **joint* (Grey dotted line):** Same baseline as above. Value: 55.70 (n/a).
* **R-PM 4.5k (Light green dotted line):** Moderate performance, shows decline. Value: 36.09 (10.96).
* **R-PM 9k (Dark green dotted line):** Better than 4.5k, but still shows decline. Value: 38.69 (7.23).
* **R-FM 4.5k (Light pink dotted line):** Moderate performance. Value: 37.31 (9.21).
* **R-FM 9k (Dark pink dotted line):** Better than 4.5k. Value: 42.36 (3.94).
* **GEM 4.5k (Light blue line):** Moderate stability. Value: 45.13 (4.96).
* **GEM 9k (Dark blue line):** Slightly lower than 4.5k in this specific metric. Value: 41.75 (5.18).
* **iCaRL 4.5k (Orange line):** High performance, tracks closely with joint*. Value: 47.27 (-1.11).
* **iCaRL 9k (Red line):** Highest performing replay method. Value: 48.76 (-1.76).
---
### Key Observations
1. **Catastrophic Forgetting:** The `finetuning` method (black dotted line) is the clear outlier, demonstrating severe catastrophic forgetting where accuracy on previous tasks drops to near zero almost immediately.
2. **Stability vs. Plasticity:** Methods like `PackNet` and `HAT` (Top Chart) show near-zero forgetting (flat lines), suggesting they effectively isolate parameters for specific tasks.
3. **Replay Effectiveness:** In the bottom chart, `iCaRL` (orange/red lines) consistently outperforms other replay methods (`GEM`, `R-PM`, `R-FM`), maintaining accuracy levels very close to the `joint*` baseline.
4. **Task Evaluation:** In every facet, the accuracy for a specific task is highest when the model is currently training on that task (indicated by the "Y" marker). As the training sequence moves to subsequent tasks (e.g., moving from T1 to T2 in the T1 evaluation facet), the accuracy generally declines for most methods.
### Interpretation
This data demonstrates the efficacy of different strategies in Continual Learning.
* **Architectural/Regularization (Top):** Methods like `PackNet` and `HAT` are highly effective at preserving knowledge, likely by freezing or masking parameters, which prevents the "overwriting" of old knowledge.
* **Replay (Bottom):** Methods like `iCaRL` demonstrate that storing a subset of previous data (replay) is a powerful way to mitigate forgetting. The performance gap between 4.5k and 9k memory sizes for `R-PM` and `R-FM` suggests that larger memory buffers generally lead to better retention, though `iCaRL` appears to be the most robust architecture among the replay methods shown.
* **The "Joint" Baseline:** The `joint*` line represents the theoretical maximum performance (training on all data at once). The closer a method's line is to this grey dotted line, the more successful it is at approximating "ideal" continual learning.
DECODING INTELLIGENCE...
EXPERT: nemotron-free VERSION 1
RUNTIME: free/nvidia/nemotron-nano-12b-v2-vl:free
INTEL_VERIFIED
## Line Graph: Accuracy Trends Across Continual Learning Tasks
### Overview
The image displays two line graphs comparing the accuracy of various continual learning methods across 10 tasks (T1–T10). Each graph tracks accuracy (%) over training sequences per task, with distinct data series represented by colored lines. The top graph includes methods like PackNet, SI, MAS, and EWC, while the bottom graph focuses on R-PM, R-FM, GEM, and iCaRL variants. A "joint*" baseline (dashed black line) is present in both graphs.
---
### Components/Axes
- **X-axis**: "Training Sequence Per Task" (T1–T10), marked with vertical dashed lines.
- **Y-axis**: "Accuracy %" (0–60%).
- **Legends**:
- **Top Legend** (left-aligned):
- finetuning (black dotted)
- PackNet (green)
- SI (orange)
- MAS (red)
- EWC (yellow)
- mode-IMM (brown)
- LwF (blue)
- EBLL (purple)
- joint* (dashed black)
- **Bottom Legend** (left-aligned):
- finetuning (black dotted)
- R-PM 4.5k (green dotted)
- R-FM 4.5k (pink dotted)
- R-PM 9k (green dash-dot)
- R-FM 9k (pink dash-dot)
- GEM 4.5k (blue)
- GEM 9k (purple)
- iCaRL 4.5k (orange)
- iCaRL 9k (red)
- joint* (dashed black)
---
### Detailed Analysis
#### Top Graph Trends
1. **finetuning (black dotted)**: Starts at ~50% (T1) but drops sharply to ~10% by T10, showing catastrophic forgetting.
2. **PackNet (green)**: Maintains ~45–49% accuracy across all tasks, with minimal fluctuation.
3. **SI (orange)**: Peaks at ~55% (T1) but declines to ~30% by T10, with erratic drops.
4. **MAS (red)**: Stable at ~45–47% until T5, then declines to ~35% by T10.
5. **EWC (yellow)**: Declines from ~42% (T1) to ~25% (T10), with gradual drops.
6. **mode-IMM (brown)**: Starts at ~36% (T1), rises to ~40% (T3), then falls to ~25% (T10).
7. **LwF (blue)**: Stable at ~40–42% until T5, then declines to ~30% (T10).
8. **EBLL (purple)**: Peaks at ~45% (T1), drops to ~35% (T5), and stabilizes at ~30% (T10).
9. **joint* (dashed black)**: Consistently ~55% accuracy across all tasks.
#### Bottom Graph Trends
1. **finetuning (black dotted)**: Same as top graph (~50% → ~10%).
2. **R-PM 4.5k (green dotted)**: Starts at ~36% (T1), drops to ~25% (T10).
3. **R-FM 4.5k (pink dotted)**: Peaks at ~37% (T1), declines to ~28% (T10).
4. **R-PM 9k (green dash-dot)**: Starts at ~38% (T1), drops to ~28% (T10).
5. **R-FM 9k (pink dash-dot)**: Peaks at ~42% (T1), declines to ~30% (T10).
6. **GEM 4.5k (blue)**: Starts at ~45% (T1), drops to ~35% (T10).
7. **GEM 9k (purple)**: Starts at ~41% (T1), declines to ~30% (T10).
8. **iCaRL 4.5k (orange)**: Peaks at ~47% (T1), declines to ~35% (T10).
9. **iCaRL 9k (red)**: Peaks at ~48% (T1), declines to ~35% (T10).
10. **joint* (dashed black)**: Consistent ~55% accuracy.
---
### Key Observations
1. **joint* Baseline**: Dominates both graphs, maintaining ~55% accuracy, suggesting it represents a robust hybrid approach.
2. **Catastrophic Forgetting**: Methods like finetuning and SI show severe accuracy drops, indicating poor retention of prior tasks.
3. **Stability**: PackNet (top) and iCaRL 9k (bottom) exhibit the most stability, retaining >30% accuracy across tasks.
4. **Performance Gaps**: Top graph methods (e.g., PackNet) outperform bottom graph methods (e.g., R-PM), suggesting architectural differences.
5. **Task-Specific Declines**: Most methods degrade after T5, with sharper drops in later tasks (T7–T10).
---
### Interpretation
The data highlights the challenges of continual learning, where methods must balance new task learning with prior knowledge retention. The **joint*** baseline’s consistent performance implies it effectively mitigates catastrophic forgetting, possibly through task-agnostic or modular design.
- **Top Graph**: Methods like PackNet and MAS prioritize stability, while SI and EWC struggle with task shifts. The absence of R-PM/R-FM variants here suggests a focus on different architectures (e.g., memory vs. regularization).
- **Bottom Graph**: R-PM/R-FM and GEM/iCaRL variants show moderate performance, with iCaRL 9k outperforming others. The inclusion of "4.5k" and "9k" likely refers to parameter counts (e.g., 4.5k vs. 9k parameters), with larger models (9k) performing slightly better but still declining over tasks.
**Notable Anomalies**:
- SI’s erratic drops (e.g., T3–T4) suggest sensitivity to hyperparameters or task order.
- EBLL’s sharp decline after T5 may indicate overfitting to early tasks.
This analysis underscores the need for methods that dynamically adapt to task complexity and preserve knowledge across diverse scenarios.
DECODING INTELLIGENCE...