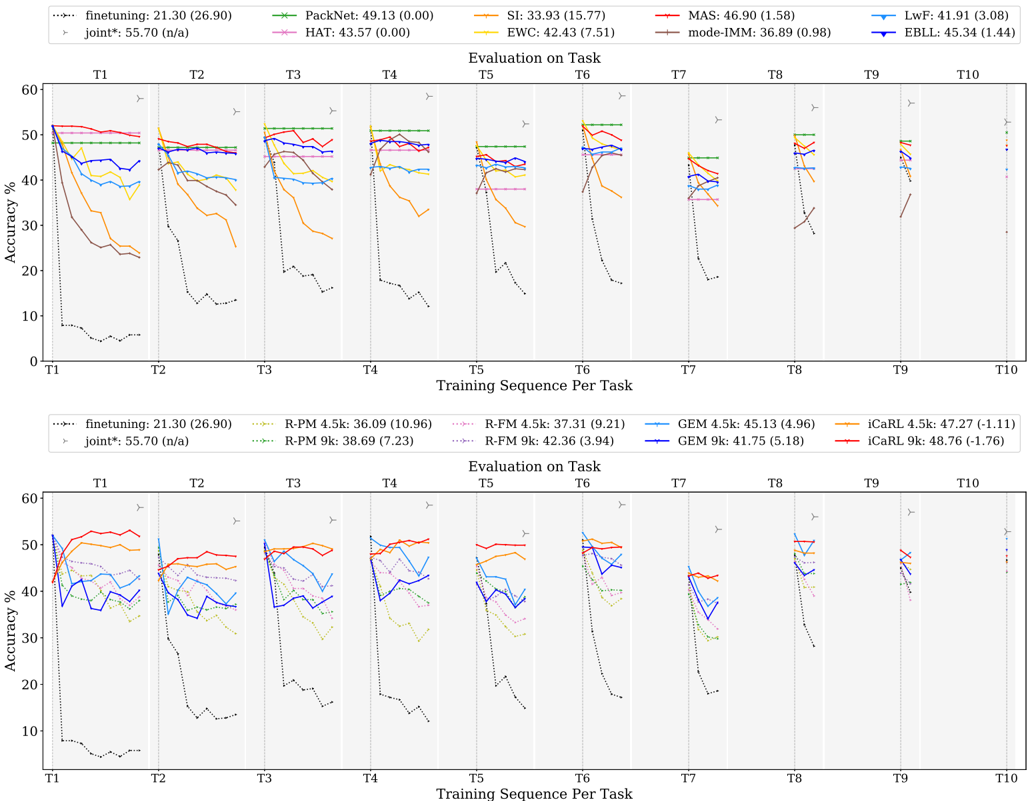
## Line Chart: Accuracy vs. Training Sequence Per Task
### Overview
The image contains two line charts comparing the accuracy of different machine learning models across a sequence of tasks (T1 to T10). The charts display the performance of various continual learning algorithms, with accuracy plotted against the training sequence per task. The top chart focuses on algorithms like Finetuning, PackNet, HAT, SI, EWC, MAS, mode-IMM, LwF, and EBLL. The bottom chart focuses on Finetuning, R-PM, R-FM, GEM, and iCaRL variants.
### Components/Axes
* **Y-axis (Accuracy %):** Ranges from 0 to 60, with tick marks at intervals of 10.
* **X-axis (Training Sequence Per Task):** Represents the sequence of tasks from T1 to T10. Each task is separated by a vertical dashed line.
* **Title (Top Chart):** Evaluation on Task
* **Title (Bottom Chart):** Evaluation on Task
* **Legend (Top Chart, top-right):**
* `finetuning`: 21.30 (26.90) - Dotted Black Line
* `joint*`: 55.70 (n/a) - Gray Line with Triangle Markers
* `PackNet`: 49.13 (0.00) - Green Line with X Markers
* `HAT`: 43.57 (0.00) - Pink Line with Star Markers
* `SI`: 33.93 (15.77) - Orange Line
* `EWC`: 42.43 (7.51) - Brown Line
* `MAS`: 46.90 (1.58) - Red Line
* `mode-IMM`: 36.89 (0.98) - Teal Line
* `LwF`: 41.91 (3.08) - Blue Line
* `EBLL`: 45.34 (1.44) - Dark Blue Line with Triangle Markers
* **Legend (Bottom Chart, bottom-center):**
* `finetuning`: 21.30 (26.90) - Dotted Black Line
* `joint*`: 55.70 (n/a) - Gray Line with Triangle Markers
* `R-PM 4.5k`: 36.09 (10.96) - Red Line with Plus Markers
* `R-PM 9k`: 38.69 (7.23) - Green Dotted Line with Plus Markers
* `R-FM 4.5k`: 37.31 (9.21) - Pink Dotted Line
* `R-FM 9k`: 42.36 (3.94) - Gray Dotted Line
* `GEM 4.5k`: 45.13 (4.96) - Light Blue Line
* `GEM 9k`: 41.75 (5.18) - Dark Blue Line
* `iCaRL 4.5k`: 47.27 (-1.11) - Yellow Line
* `iCaRL 9k`: 48.76 (-1.76) - Red Line
### Detailed Analysis
**Top Chart:**
* **Finetuning (Dotted Black Line):** Starts low (around 5% at T1) and remains consistently low across all tasks, indicating poor performance.
* **Joint\* (Gray Line with Triangle Markers):** Starts high (around 55% at T1) and remains relatively stable across all tasks.
* **PackNet (Green Line with X Markers):** Starts high (around 50% at T1) and remains relatively stable across all tasks.
* **HAT (Pink Line with Star Markers):** Starts around 50% at T1, decreases slightly, and then stabilizes.
* **SI (Orange Line):** Starts around 50% at T1, decreases significantly by T2, and then continues to decrease gradually.
* **EWC (Brown Line):** Starts around 40% at T1, decreases significantly by T2, and then continues to decrease gradually.
* **MAS (Red Line):** Starts around 50% at T1, decreases slightly, and then stabilizes.
* **mode-IMM (Teal Line):** Starts around 40% at T1, decreases slightly, and then stabilizes.
* **LwF (Blue Line):** Starts around 40% at T1, decreases slightly, and then stabilizes.
* **EBLL (Dark Blue Line with Triangle Markers):** Starts around 45% at T1, decreases slightly, and then stabilizes.
**Bottom Chart:**
* **Finetuning (Dotted Black Line):** Starts low (around 5% at T1) and remains consistently low across all tasks, indicating poor performance.
* **Joint\* (Gray Line with Triangle Markers):** Starts high (around 55% at T1) and remains relatively stable across all tasks.
* **R-PM 4.5k (Red Line with Plus Markers):** Starts around 50% at T1, decreases significantly by T2, and then continues to decrease gradually.
* **R-PM 9k (Green Dotted Line with Plus Markers):** Starts around 40% at T1, decreases significantly by T2, and then continues to decrease gradually.
* **R-FM 4.5k (Pink Dotted Line):** Starts around 45% at T1, decreases significantly by T2, and then continues to decrease gradually.
* **R-FM 9k (Gray Dotted Line):** Starts around 50% at T1, decreases significantly by T2, and then continues to decrease gradually.
* **GEM 4.5k (Light Blue Line):** Starts around 40% at T1, decreases slightly, and then stabilizes.
* **GEM 9k (Dark Blue Line):** Starts around 40% at T1, decreases slightly, and then stabilizes.
* **iCaRL 4.5k (Yellow Line):** Starts around 50% at T1, decreases slightly, and then stabilizes.
* **iCaRL 9k (Red Line):** Starts around 50% at T1, decreases slightly, and then stabilizes.
### Key Observations
* **Finetuning:** Consistently performs poorly across all tasks in both charts.
* **Joint\*:** Maintains high accuracy across all tasks in both charts.
* **Performance Drop:** Many algorithms experience a significant drop in accuracy between T1 and T2, indicating catastrophic forgetting.
* **Stabilization:** After the initial drop, most algorithms stabilize, suggesting they retain some knowledge from previous tasks.
* **Algorithm Comparison:** Algorithms like PackNet, HAT, MAS, EBLL, iCaRL, and GEM variants show relatively better performance compared to Finetuning, SI, EWC, and R-PM/R-FM variants.
### Interpretation
The charts illustrate the challenges of continual learning, where models struggle to maintain performance on previous tasks as they learn new ones. Finetuning, a naive approach, suffers significantly from catastrophic forgetting. Joint training (Joint\*) provides a strong baseline, demonstrating the performance achievable when all data is available at once. Algorithms like PackNet, HAT, MAS, EBLL, iCaRL, and GEM variants represent more sophisticated approaches to continual learning, mitigating catastrophic forgetting to varying degrees. The initial drop in accuracy between T1 and T2 highlights the difficulty of retaining knowledge from the first task when learning subsequent tasks. The subsequent stabilization suggests that these algorithms are partially successful in preserving previously learned information.