## Multi-panel Line Chart: Continual Learning Accuracy Evaluation
### Overview
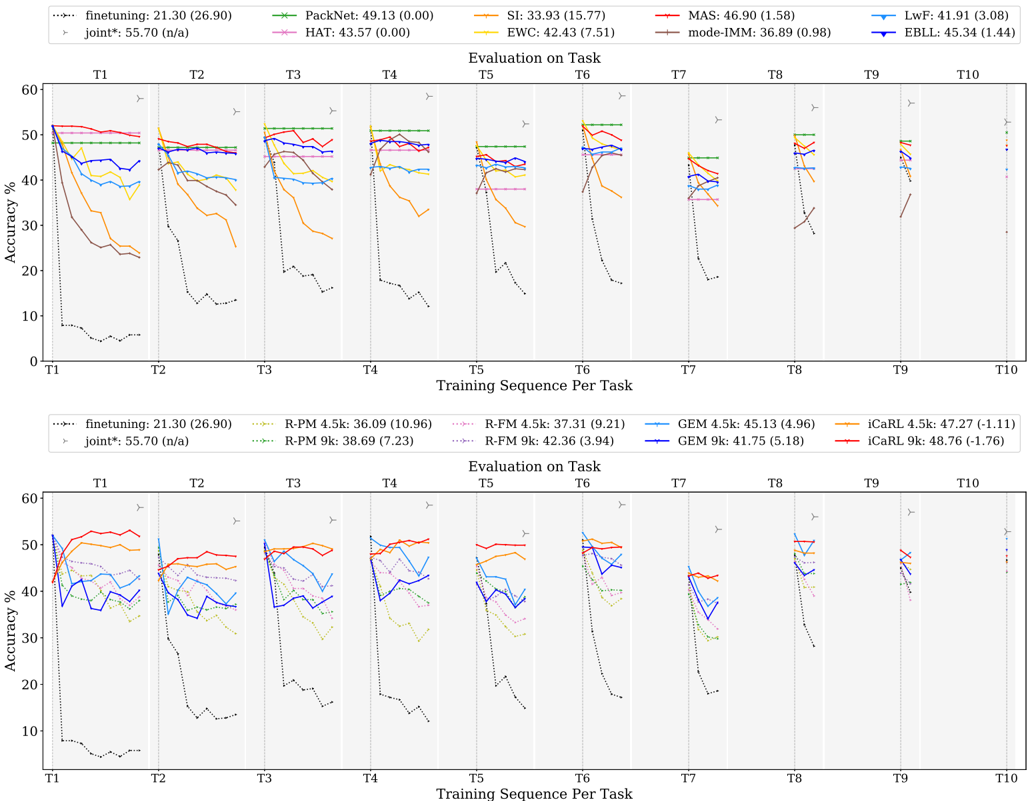
The image consists of two stacked, multi-panel line charts (facet grids) evaluating the performance of various machine learning algorithms across a sequence of 10 tasks (T1 through T10). The charts visualize the phenomenon of "catastrophic forgetting," where models lose accuracy on previous tasks as they learn new ones. The Y-axis represents "Accuracy %" (0-60), and the X-axis represents the "Training Sequence Per Task" (T1-T10). Each facet represents the "Evaluation on Task" (T1-T10), showing how accuracy on a specific task evolves as the model trains on subsequent tasks.
### Components/Axes
* **Y-Axis:** "Accuracy %", ranging from 0 to 60.
* **X-Axis:** "Training Sequence Per Task", labeled T1 through T10.
* **Facets:** Each chart is divided into 10 vertical panels labeled T1 through T10 at the top, representing the task being evaluated.
* **Markers:** A small "Y" symbol appears at the top right of each facet, indicating the current task being trained.
* **Legends:** Located at the top of each chart, defining the color-coded lines and providing summary statistics (Average Accuracy and likely standard deviation/forgetting metric in parentheses).
---
### Detailed Analysis
#### Top Chart: Regularization and Architectural Methods
This chart compares methods that typically use regularization or architectural changes to prevent forgetting.
**Legend & Data Series:**
* **finetuning (Black dotted line):** Starts at ~50% at T1, but drops precipitously to <10% by T2/T3. Value: 21.30 (26.90).
* **joint* (Grey dotted line):** The upper-bound baseline. Remains consistently high across all tasks. Value: 55.70 (n/a).
* **PackNet (Green line, 'x' markers):** Extremely stable; maintains high accuracy across all tasks. Value: 49.13 (0.00).
* **HAT (Pink line, 'x' markers):** Very stable, slightly lower than PackNet. Value: 43.57 (0.00).
* **SI (Orange line):** Shows a significant downward trend as tasks progress. Value: 33.93 (15.77).
* **EWC (Yellow line):** Moderate stability, shows a downward slope. Value: 42.43 (7.51).
* **MAS (Red line):** Relatively stable, tracks near the top performers. Value: 46.90 (1.58).
* **mode-IMM (Brown line):** Shows a sharp decline similar to finetuning, though slightly better. Value: 36.89 (0.98).
* **LwF (Light blue line):** Moderate decline. Value: 41.91 (3.08).
* **EBLL (Dark blue line):** Moderate stability. Value: 45.34 (1.44).
#### Bottom Chart: Replay/Memory-Based Methods
This chart compares methods that utilize memory buffers (replay) of varying sizes (4.5k and 9k).
**Legend & Data Series:**
* **finetuning (Black dotted line):** Same baseline as above. Value: 21.30 (26.90).
* **joint* (Grey dotted line):** Same baseline as above. Value: 55.70 (n/a).
* **R-PM 4.5k (Light green dotted line):** Moderate performance, shows decline. Value: 36.09 (10.96).
* **R-PM 9k (Dark green dotted line):** Better than 4.5k, but still shows decline. Value: 38.69 (7.23).
* **R-FM 4.5k (Light pink dotted line):** Moderate performance. Value: 37.31 (9.21).
* **R-FM 9k (Dark pink dotted line):** Better than 4.5k. Value: 42.36 (3.94).
* **GEM 4.5k (Light blue line):** Moderate stability. Value: 45.13 (4.96).
* **GEM 9k (Dark blue line):** Slightly lower than 4.5k in this specific metric. Value: 41.75 (5.18).
* **iCaRL 4.5k (Orange line):** High performance, tracks closely with joint*. Value: 47.27 (-1.11).
* **iCaRL 9k (Red line):** Highest performing replay method. Value: 48.76 (-1.76).
---
### Key Observations
1. **Catastrophic Forgetting:** The `finetuning` method (black dotted line) is the clear outlier, demonstrating severe catastrophic forgetting where accuracy on previous tasks drops to near zero almost immediately.
2. **Stability vs. Plasticity:** Methods like `PackNet` and `HAT` (Top Chart) show near-zero forgetting (flat lines), suggesting they effectively isolate parameters for specific tasks.
3. **Replay Effectiveness:** In the bottom chart, `iCaRL` (orange/red lines) consistently outperforms other replay methods (`GEM`, `R-PM`, `R-FM`), maintaining accuracy levels very close to the `joint*` baseline.
4. **Task Evaluation:** In every facet, the accuracy for a specific task is highest when the model is currently training on that task (indicated by the "Y" marker). As the training sequence moves to subsequent tasks (e.g., moving from T1 to T2 in the T1 evaluation facet), the accuracy generally declines for most methods.
### Interpretation
This data demonstrates the efficacy of different strategies in Continual Learning.
* **Architectural/Regularization (Top):** Methods like `PackNet` and `HAT` are highly effective at preserving knowledge, likely by freezing or masking parameters, which prevents the "overwriting" of old knowledge.
* **Replay (Bottom):** Methods like `iCaRL` demonstrate that storing a subset of previous data (replay) is a powerful way to mitigate forgetting. The performance gap between 4.5k and 9k memory sizes for `R-PM` and `R-FM` suggests that larger memory buffers generally lead to better retention, though `iCaRL` appears to be the most robust architecture among the replay methods shown.
* **The "Joint" Baseline:** The `joint*` line represents the theoretical maximum performance (training on all data at once). The closer a method's line is to this grey dotted line, the more successful it is at approximating "ideal" continual learning.