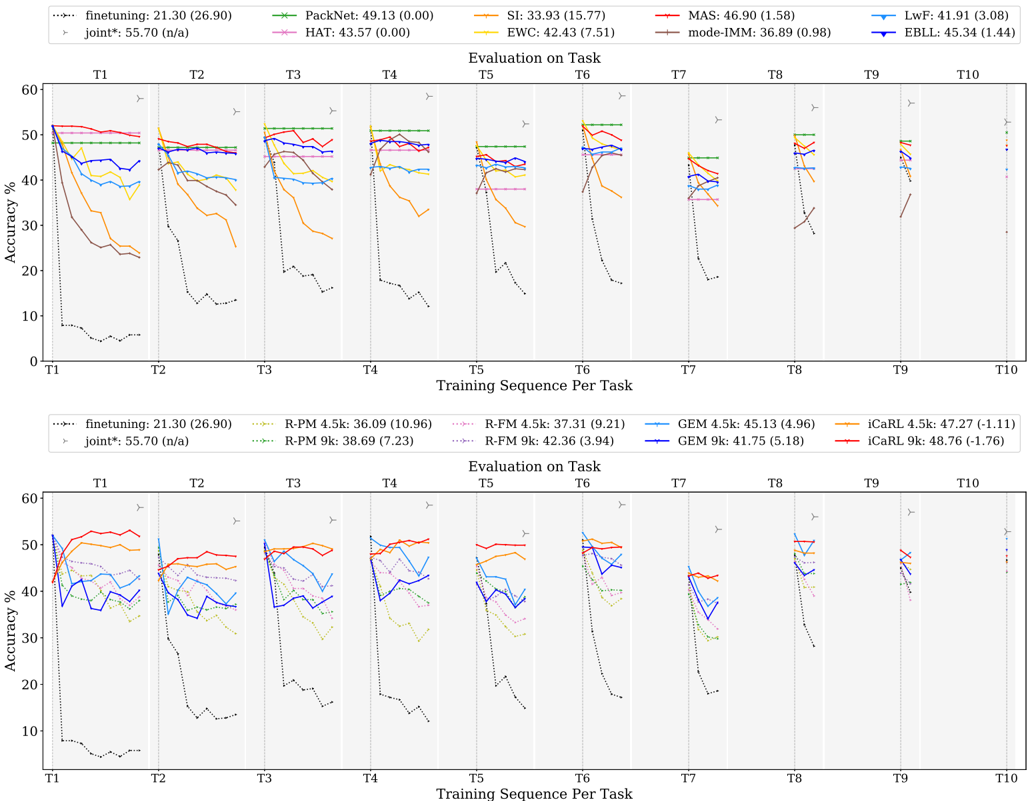
## Line Graph: Accuracy Trends Across Continual Learning Tasks
### Overview
The image displays two line graphs comparing the accuracy of various continual learning methods across 10 tasks (T1–T10). Each graph tracks accuracy (%) over training sequences per task, with distinct data series represented by colored lines. The top graph includes methods like PackNet, SI, MAS, and EWC, while the bottom graph focuses on R-PM, R-FM, GEM, and iCaRL variants. A "joint*" baseline (dashed black line) is present in both graphs.
---
### Components/Axes
- **X-axis**: "Training Sequence Per Task" (T1–T10), marked with vertical dashed lines.
- **Y-axis**: "Accuracy %" (0–60%).
- **Legends**:
- **Top Legend** (left-aligned):
- finetuning (black dotted)
- PackNet (green)
- SI (orange)
- MAS (red)
- EWC (yellow)
- mode-IMM (brown)
- LwF (blue)
- EBLL (purple)
- joint* (dashed black)
- **Bottom Legend** (left-aligned):
- finetuning (black dotted)
- R-PM 4.5k (green dotted)
- R-FM 4.5k (pink dotted)
- R-PM 9k (green dash-dot)
- R-FM 9k (pink dash-dot)
- GEM 4.5k (blue)
- GEM 9k (purple)
- iCaRL 4.5k (orange)
- iCaRL 9k (red)
- joint* (dashed black)
---
### Detailed Analysis
#### Top Graph Trends
1. **finetuning (black dotted)**: Starts at ~50% (T1) but drops sharply to ~10% by T10, showing catastrophic forgetting.
2. **PackNet (green)**: Maintains ~45–49% accuracy across all tasks, with minimal fluctuation.
3. **SI (orange)**: Peaks at ~55% (T1) but declines to ~30% by T10, with erratic drops.
4. **MAS (red)**: Stable at ~45–47% until T5, then declines to ~35% by T10.
5. **EWC (yellow)**: Declines from ~42% (T1) to ~25% (T10), with gradual drops.
6. **mode-IMM (brown)**: Starts at ~36% (T1), rises to ~40% (T3), then falls to ~25% (T10).
7. **LwF (blue)**: Stable at ~40–42% until T5, then declines to ~30% (T10).
8. **EBLL (purple)**: Peaks at ~45% (T1), drops to ~35% (T5), and stabilizes at ~30% (T10).
9. **joint* (dashed black)**: Consistently ~55% accuracy across all tasks.
#### Bottom Graph Trends
1. **finetuning (black dotted)**: Same as top graph (~50% → ~10%).
2. **R-PM 4.5k (green dotted)**: Starts at ~36% (T1), drops to ~25% (T10).
3. **R-FM 4.5k (pink dotted)**: Peaks at ~37% (T1), declines to ~28% (T10).
4. **R-PM 9k (green dash-dot)**: Starts at ~38% (T1), drops to ~28% (T10).
5. **R-FM 9k (pink dash-dot)**: Peaks at ~42% (T1), declines to ~30% (T10).
6. **GEM 4.5k (blue)**: Starts at ~45% (T1), drops to ~35% (T10).
7. **GEM 9k (purple)**: Starts at ~41% (T1), declines to ~30% (T10).
8. **iCaRL 4.5k (orange)**: Peaks at ~47% (T1), declines to ~35% (T10).
9. **iCaRL 9k (red)**: Peaks at ~48% (T1), declines to ~35% (T10).
10. **joint* (dashed black)**: Consistent ~55% accuracy.
---
### Key Observations
1. **joint* Baseline**: Dominates both graphs, maintaining ~55% accuracy, suggesting it represents a robust hybrid approach.
2. **Catastrophic Forgetting**: Methods like finetuning and SI show severe accuracy drops, indicating poor retention of prior tasks.
3. **Stability**: PackNet (top) and iCaRL 9k (bottom) exhibit the most stability, retaining >30% accuracy across tasks.
4. **Performance Gaps**: Top graph methods (e.g., PackNet) outperform bottom graph methods (e.g., R-PM), suggesting architectural differences.
5. **Task-Specific Declines**: Most methods degrade after T5, with sharper drops in later tasks (T7–T10).
---
### Interpretation
The data highlights the challenges of continual learning, where methods must balance new task learning with prior knowledge retention. The **joint*** baseline’s consistent performance implies it effectively mitigates catastrophic forgetting, possibly through task-agnostic or modular design.
- **Top Graph**: Methods like PackNet and MAS prioritize stability, while SI and EWC struggle with task shifts. The absence of R-PM/R-FM variants here suggests a focus on different architectures (e.g., memory vs. regularization).
- **Bottom Graph**: R-PM/R-FM and GEM/iCaRL variants show moderate performance, with iCaRL 9k outperforming others. The inclusion of "4.5k" and "9k" likely refers to parameter counts (e.g., 4.5k vs. 9k parameters), with larger models (9k) performing slightly better but still declining over tasks.
**Notable Anomalies**:
- SI’s erratic drops (e.g., T3–T4) suggest sensitivity to hyperparameters or task order.
- EBLL’s sharp decline after T5 may indicate overfitting to early tasks.
This analysis underscores the need for methods that dynamically adapt to task complexity and preserve knowledge across diverse scenarios.