## Horizontal Bar Chart: AI Model Accuracy Across Document Understanding Capabilities
### Overview
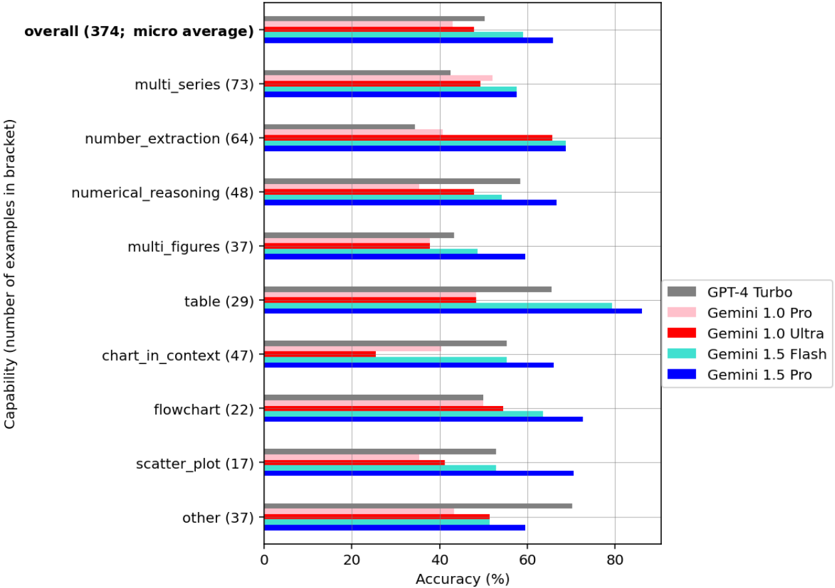
This image is a horizontal bar chart comparing the accuracy percentages of five different AI models across nine distinct document understanding capabilities, plus an overall average. The chart is designed to benchmark performance on tasks involving numerical and structural data extraction from documents.
### Components/Axes
* **Chart Type:** Horizontal grouped bar chart.
* **Y-Axis (Vertical):** Labeled "Capability (number of examples in bracket)". It lists 10 categories. From top to bottom:
1. `overall (374; micro average)`
2. `multi_series (73)`
3. `number_extraction (64)`
4. `numerical_reasoning (48)`
5. `multi_figures (37)`
6. `table (29)`
7. `chart_in_context (47)`
8. `flowchart (22)`
9. `scatter_plot (17)`
10. `other (37)`
* **X-Axis (Horizontal):** Labeled "Accuracy (%)". The scale runs from 0 to 80, with major tick marks at 0, 20, 40, 60, and 80.
* **Legend:** Positioned on the right side of the chart. It maps colors to model names:
* Gray: `GPT-4 Turbo`
* Light Pink: `Gemini 1.0 Pro`
* Red: `Gemini 1.0 Ultra`
* Cyan: `Gemini 1.5 Flash`
* Blue: `Gemini 1.5 Pro`
### Detailed Analysis
Below is the extracted accuracy data for each capability, listed by model. Values are approximate based on visual alignment with the x-axis grid.
**1. overall (374; micro average)**
* GPT-4 Turbo (Gray): ~50%
* Gemini 1.0 Pro (Pink): ~48%
* Gemini 1.0 Ultra (Red): ~58%
* Gemini 1.5 Flash (Cyan): ~60%
* Gemini 1.5 Pro (Blue): ~65%
**2. multi_series (73)**
* GPT-4 Turbo (Gray): ~42%
* Gemini 1.0 Pro (Pink): ~52%
* Gemini 1.0 Ultra (Red): ~48%
* Gemini 1.5 Flash (Cyan): ~55%
* Gemini 1.5 Pro (Blue): ~58%
**3. number_extraction (64)**
* GPT-4 Turbo (Gray): ~35%
* Gemini 1.0 Pro (Pink): ~40%
* Gemini 1.0 Ultra (Red): ~65%
* Gemini 1.5 Flash (Cyan): ~60%
* Gemini 1.5 Pro (Blue): ~68%
**4. numerical_reasoning (48)**
* GPT-4 Turbo (Gray): ~58%
* Gemini 1.0 Pro (Pink): ~48%
* Gemini 1.0 Ultra (Red): ~48%
* Gemini 1.5 Flash (Cyan): ~55%
* Gemini 1.5 Pro (Blue): ~65%
**5. multi_figures (37)**
* GPT-4 Turbo (Gray): ~42%
* Gemini 1.0 Pro (Pink): ~38%
* Gemini 1.0 Ultra (Red): ~40%
* Gemini 1.5 Flash (Cyan): ~48%
* Gemini 1.5 Pro (Blue): ~60%
**6. table (29)**
* GPT-4 Turbo (Gray): ~65%
* Gemini 1.0 Pro (Pink): ~48%
* Gemini 1.0 Ultra (Red): ~48%
* Gemini 1.5 Flash (Cyan): ~80%
* Gemini 1.5 Pro (Blue): ~85%
**7. chart_in_context (47)**
* GPT-4 Turbo (Gray): ~55%
* Gemini 1.0 Pro (Pink): ~40%
* Gemini 1.0 Ultra (Red): ~25%
* Gemini 1.5 Flash (Cyan): ~55%
* Gemini 1.5 Pro (Blue): ~65%
**8. flowchart (22)**
* GPT-4 Turbo (Gray): ~50%
* Gemini 1.0 Pro (Pink): ~50%
* Gemini 1.0 Ultra (Red): ~55%
* Gemini 1.5 Flash (Cyan): ~62%
* Gemini 1.5 Pro (Blue): ~72%
**9. scatter_plot (17)**
* GPT-4 Turbo (Gray): ~52%
* Gemini 1.0 Pro (Pink): ~40%
* Gemini 1.0 Ultra (Red): ~40%
* Gemini 1.5 Flash (Cyan): ~52%
* Gemini 1.5 Pro (Blue): ~70%
**10. other (37)**
* GPT-4 Turbo (Gray): ~70%
* Gemini 1.0 Pro (Pink): ~48%
* Gemini 1.0 Ultra (Red): ~52%
* Gemini 1.5 Flash (Cyan): ~58%
* Gemini 1.5 Pro (Blue): ~60%
### Key Observations
1. **Model Performance Hierarchy:** The blue bars (`Gemini 1.5 Pro`) are consistently the longest or among the longest across nearly all categories, indicating it is the top-performing model overall. The light pink bars (`Gemini 1.0 Pro`) are frequently the shortest.
2. **Task-Specific Strengths:**
* The `table` capability shows the highest overall accuracy scores, with `Gemini 1.5 Pro` and `Gemini 1.5 Flash` achieving ~85% and ~80% respectively.
* The `chart_in_context` task shows a significant performance dip for `Gemini 1.0 Ultra` (Red bar at ~25%), which is a notable outlier for that model.
* `GPT-4 Turbo` (Gray) shows its strongest relative performance in the `other` category (~70%) and `table` (~65%).
3. **Generational Improvement:** Within the Gemini family, the 1.5 series (Flash and Pro) generally outperforms the 1.0 series (Pro and Ultra) across most tasks, suggesting a clear generational advancement.
4. **Variability:** Performance is highly variable by task. For example, accuracy on `scatter_plot` ranges from ~40% to ~70%, while on `table` it ranges from ~48% to ~85%.
### Interpretation
This chart provides a comparative benchmark for AI models on specialized document understanding tasks that involve extracting and reasoning about structured data (tables, charts, numbers). The data suggests that:
* **Gemini 1.5 Pro is the current leader** in this specific benchmark, demonstrating robust and often superior performance across a wide range of document intelligence tasks.
* **Task difficulty varies significantly.** Models struggle more with tasks like `chart_in_context` and `scatter_plot` compared to `table` extraction, likely due to the need for higher-level spatial and contextual reasoning versus direct cell/coordinate parsing.
* **The "overall" score is a micro-average,** meaning it's weighted by the number of examples per category. The high performance on `table` (29 examples) and `multi_series` (73 examples) likely pulls the overall average up, while lower performance on smaller categories like `scatter_plot` (17 examples) has less impact.
* **The outlier in `chart_in_context` for Gemini 1.0 Ultra** may indicate a specific weakness in that model version for integrating chart data with surrounding textual context, a flaw that appears corrected in the 1.5 series.
* **Practical Implication:** For applications requiring extraction from complex documents with mixed tables, charts, and figures, the choice of model (particularly Gemini 1.5 Pro or Flash) could lead to substantially more accurate results compared to older generations. The benchmark highlights that model capability is not monolithic but highly dependent on the specific sub-task.