## Line Chart: Distribution of Router Stability (Noise = 0.01)
### Overview
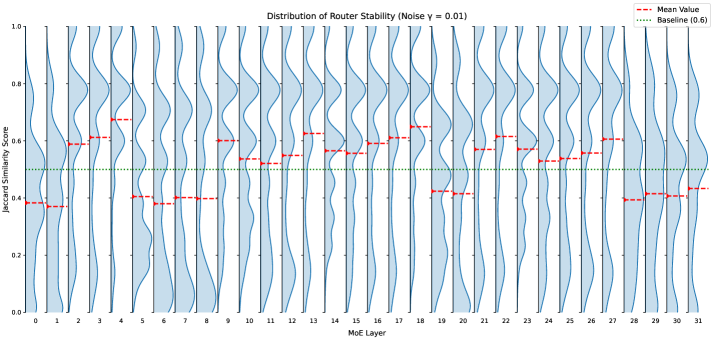
The chart visualizes the distribution of router stability across 32 MoE (Mixture of Experts) layers, with a focus on Jaccard Similarity Scores. Two data series are plotted: a red dashed line representing the "Mean Value" and a green dotted line labeled "Baseline (0.6)". The background features blue shaded regions indicating variability in the distribution.
### Components/Axes
- **X-Axis**: Labeled "MoE Layer", with integer markers from 0 to 31.
- **Y-Axis**: Labeled "Jaccard Similarity Score", scaled from 0.0 to 1.0 in increments of 0.2.
- **Legend**: Located in the top-right corner, with:
- Red dashed line: "Mean Value"
- Green dotted line: "Baseline (0.6)"
- **Background**: Blue shaded areas represent the distribution of values across MoE layers.
### Detailed Analysis
1. **Mean Value (Red Dashed Line)**:
- Fluctuates sinusoidally around the green baseline (0.6).
- Peaks above 0.6 at MoE Layers 3, 13, 17, 21, 25, and 29.
- Dips below 0.6 at MoE Layers 5, 9, 15, 19, 23, and 27.
- Average trend: Slightly oscillatory with no clear upward/downward bias.
2. **Baseline (Green Dotted Line)**:
- Constant horizontal line at 0.6 across all MoE layers.
3. **Blue Shaded Regions**:
- Width varies across layers, indicating variability in Jaccard Similarity Scores.
- Narrowest at MoE Layers 0, 4, 8, 12, 16, 20, 24, 28 (indicating lower variability).
- Widest at MoE Layers 2, 6, 10, 14, 18, 22, 26, 30 (indicating higher variability).
### Key Observations
- The Mean Value consistently oscillates around the baseline, suggesting periodic stability variations.
- MoE Layers 3, 13, 17, 21, 25, and 29 exhibit the highest stability (Mean Value > 0.6).
- MoE Layers 5, 9, 15, 19, 23, and 27 show the lowest stability (Mean Value < 0.6).
- Blue shaded regions correlate with the amplitude of the red line’s oscillations: wider regions align with larger deviations from the baseline.
### Interpretation
The chart demonstrates that router stability (as measured by Jaccard Similarity) varies cyclically across MoE layers. The baseline (0.6) likely represents a target or expected stability threshold. Layers with Mean Values above 0.6 (e.g., Layer 3, 13) are more stable, while those below (e.g., Layer 5, 9) are less stable. The blue shaded regions highlight layers with higher variability, suggesting these MoE layers may require further investigation for optimization. The sinusoidal pattern implies a systematic relationship between MoE layer position and stability, potentially tied to architectural design or noise propagation in the model.