## Grouped Bar Chart: GAIA Test Performance by Model and Level
### Overview
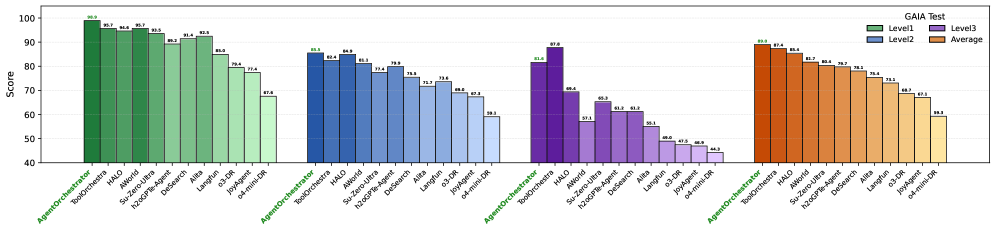
The image displays a grouped bar chart titled "GAIA Test," comparing the performance scores of 12 different AI models or systems across three difficulty levels (Level1, Level2, Level3) and their overall Average. The chart is organized into four distinct color-coded groups, each representing one of these categories.
### Components/Axes
* **Chart Title:** "GAIA Test" (located in the top-right corner).
* **Y-Axis:** Labeled "Score," with a linear scale ranging from 40 to 100, marked at intervals of 10 (40, 50, 60, 70, 80, 90, 100).
* **X-Axis:** Lists 12 model/system names. These names are repeated identically under each of the four color-coded groups. The names are (from left to right within a group):
1. AgentOrchestrator
2. ToolOrchestrator
3. HALO
4. AReaL
5. Search-Omni
6. Search-Omni-7B
7. Defect-13B
8. ARIA
9. Llama-3-8B
10. o1-mini
11. o1-preview
12. 2-shot-o1-mini
* **Legend:** Positioned in the top-right corner, below the title. It defines the four color-coded groups:
* **Level1:** Green bars
* **Level2:** Blue bars
* **Level3:** Purple bars
* **Average:** Orange bars
### Detailed Analysis
The data is presented in four clusters, each corresponding to a legend category. Within each cluster, the 12 models are listed in the same order. The score for each model is displayed as a number directly above its corresponding bar.
**Group 1: Level1 (Green Bars)**
* **Trend:** Scores show a general downward trend from left to right, with a significant drop for the last three models.
* **Data Points (Model: Score):**
* AgentOrchestrator: 98.7
* ToolOrchestrator: 96.0
* HALO: 96.0
* AReaL: 95.7
* Search-Omni: 90.7
* Search-Omni-7B: 92.4
* Defect-13B: 91.7
* ARIA: 80.4
* Llama-3-8B: 77.4
* o1-mini: 67.4
* o1-preview: (Bar present, but score label is not clearly visible; appears to be ~65-70 based on bar height)
* 2-shot-o1-mini: (Bar present, but score label is not clearly visible; appears to be ~65-70 based on bar height)
**Group 2: Level2 (Blue Bars)**
* **Trend:** Scores are generally lower than Level1 for the same models. The trend is less uniform, with some models (e.g., Search-Omni-7B) scoring higher than their immediate neighbors.
* **Data Points (Model: Score):**
* AgentOrchestrator: 85.5
* ToolOrchestrator: 84.0
* HALO: 85.8
* AReaL: 81.3
* Search-Omni: 77.4
* Search-Omni-7B: 79.0
* Defect-13B: 76.5
* ARIA: 72.2
* Llama-3-8B: 70.8
* o1-mini: 68.6
* o1-preview: 67.8
* 2-shot-o1-mini: 59.3
**Group 3: Level3 (Purple Bars)**
* **Trend:** This group shows the lowest scores overall and the steepest decline from left to right. The performance gap between the top models and the bottom models is most pronounced here.
* **Data Points (Model: Score):**
* AgentOrchestrator: 81.8
* ToolOrchestrator: 87.8
* HALO: 68.8
* AReaL: 57.1
* Search-Omni: 65.3
* Search-Omni-7B: 60.8
* Defect-13B: 60.8
* ARIA: 55.1
* Llama-3-8B: 48.0
* o1-mini: 47.0
* o1-preview: 46.8
* 2-shot-o1-mini: 44.2
**Group 4: Average (Orange Bars)**
* **Trend:** Represents the mean performance across levels. The trend mirrors the general pattern of Level1 and Level2, showing a steady decline from the top-performing models to the lower-performing ones.
* **Data Points (Model: Score):**
* AgentOrchestrator: 88.7
* ToolOrchestrator: 87.4
* HALO: 85.7
* AReaL: 78.2
* Search-Omni: 77.7
* Search-Omni-7B: 76.9
* Defect-13B: 76.3
* ARIA: 69.3
* Llama-3-8B: 65.7
* o1-mini: 61.1
* o1-preview: 59.7
* 2-shot-o1-mini: 57.0
### Key Observations
1. **Consistent Top Performers:** `AgentOrchestrator`, `ToolOrchestrator`, and `HALO` consistently occupy the top three positions across all levels and the average.
2. **Level Difficulty:** For nearly every model, the score is highest on Level1, lower on Level2, and lowest on Level3, confirming that the GAIA test levels increase in difficulty.
3. **Notable Anomaly:** `ToolOrchestrator` outperforms `AgentOrchestrator` on the most difficult Level3 (87.8 vs. 81.8), despite scoring slightly lower on Level1 and the Average. This suggests `ToolOrchestrator` may be more robust for complex tasks.
4. **Significant Performance Drop-off:** There is a clear divide. The first 7-8 models maintain relatively high scores, while models from `Llama-3-8B` onwards show a marked decrease in performance, especially on Level3 where scores fall below 50.
5. **Language:** All text in the chart is in English.
### Interpretation
This chart provides a comparative benchmark of AI systems on the GAIA test, which likely evaluates general AI capabilities across varying difficulty tiers. The data suggests a hierarchy of capability among the tested systems.
The **Peircean investigative reading** reveals several layers:
* **Iconic:** The visual decline in bar height from left to right within each group is an iconic representation of decreasing capability.
* **Indexical:** The consistent ordering of models across groups indexes a stable ranking. The fact that Level3 scores are universally the lowest is an index of that level's increased complexity.
* **Symbolic:** The "GAIA Test" title symbolizes a standardized evaluation framework. The color coding (green to purple to orange) symbolically groups the data into meaningful categories for analysis.
The key takeaway is that specialized, orchestrated systems (`AgentOrchestrator`, `ToolOrchestrator`) significantly outperform both other specialized models and general-purpose language models (like the `o1` series and `Llama-3-8B`) on this benchmark. The dramatic falloff on Level3 indicates that the most challenging tasks in this test expose substantial limitations in many current AI systems, while highlighting the relative robustness of the top-performing orchestrated approaches. The "Average" column serves as a useful single metric but masks the critical insight that performance is not uniform across task difficulties.