## Diagram: LLM Response Generation
### Overview
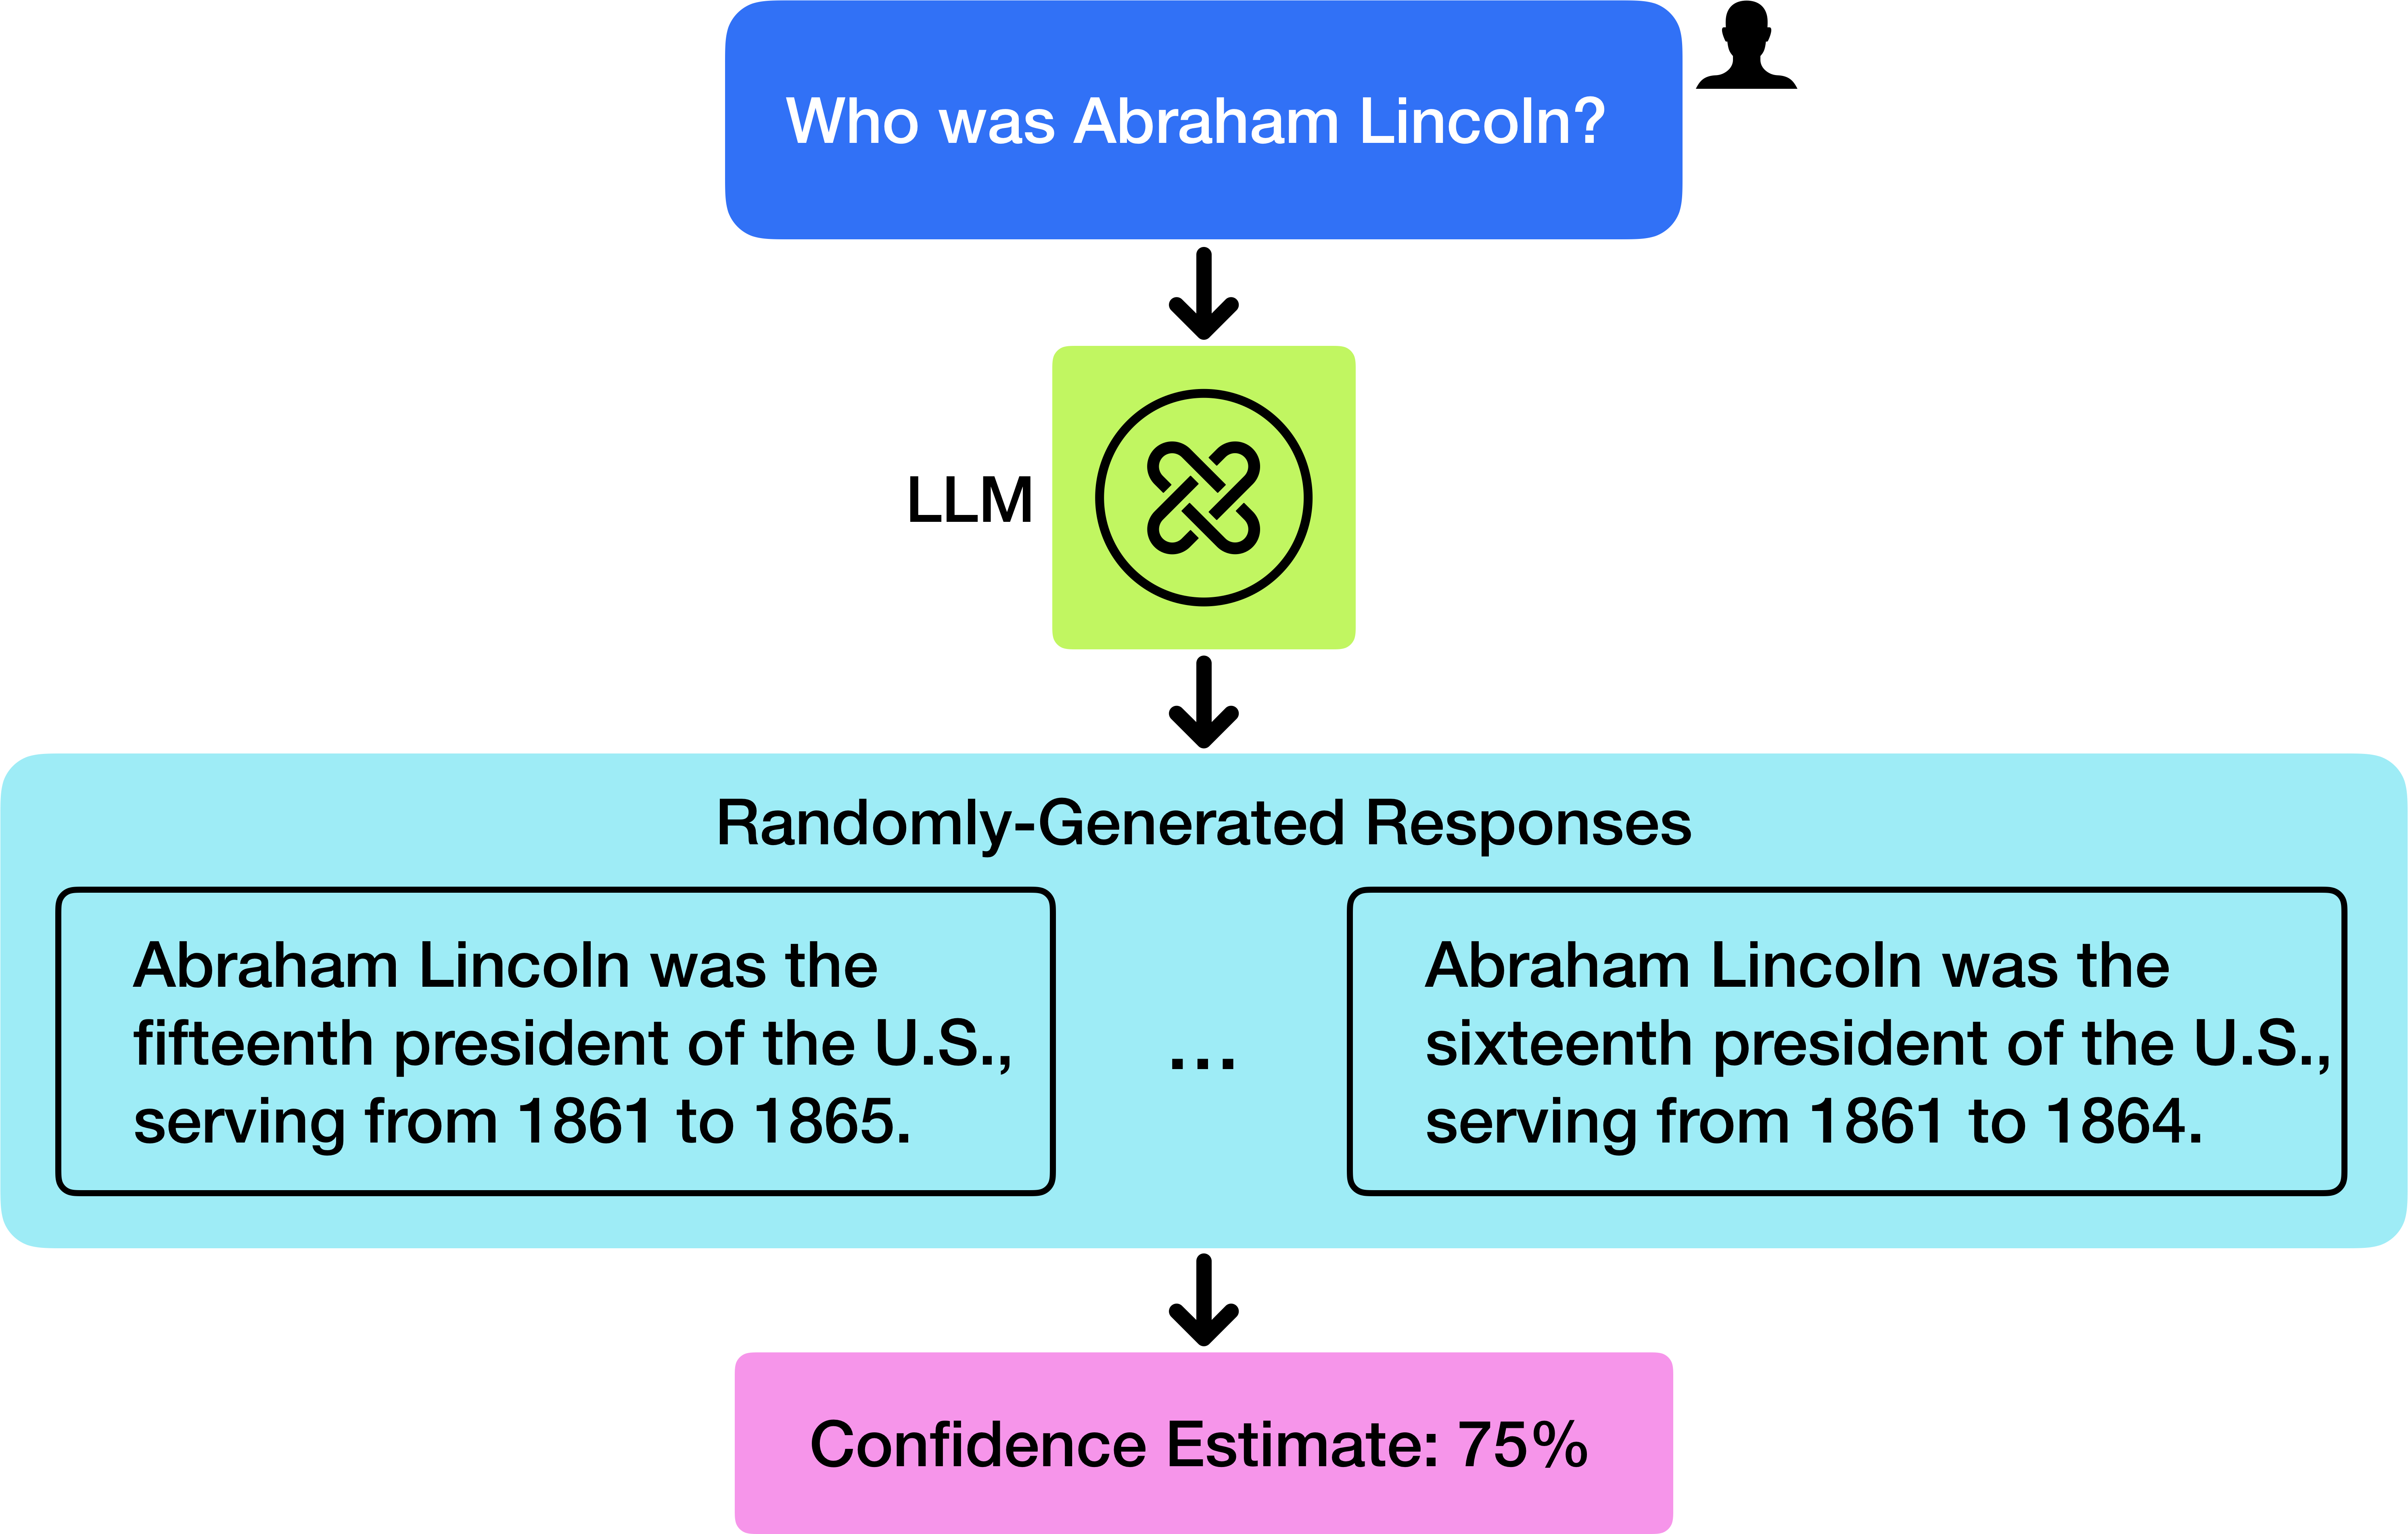
The image is a diagram illustrating the process of generating responses to the question "Who was Abraham Lincoln?" using a Large Language Model (LLM). It shows the flow from the initial question, through the LLM, to randomly-generated responses, and finally to a confidence estimate.
### Components/Axes
* **Top:** Blue rectangle containing the question "Who was Abraham Lincoln?" with a silhouette of a person's head in the top right corner.
* **Middle-Top:** Green square labeled "LLM" with a symbol resembling interconnected nodes inside.
* **Middle:** Light blue rectangle labeled "Randomly-Generated Responses" containing two example responses.
* **Bottom:** Pink rectangle labeled "Confidence Estimate: 75%".
* **Arrows:** Black arrows indicating the flow of information from top to bottom.
### Detailed Analysis
* **Question:** The initial question is "Who was Abraham Lincoln?".
* **LLM:** The LLM processes the question.
* **Randomly-Generated Responses:**
* Response 1: "Abraham Lincoln was the fifteenth president of the U.S., serving from 1861 to 1865."
* Response 2: "Abraham Lincoln was the sixteenth president of the U.S., serving from 1861 to 1864."
* There is an ellipsis "..." between the two responses, indicating that there are more randomly generated responses.
* **Confidence Estimate:** The confidence estimate for the responses is 75%.
### Key Observations
* The LLM generates multiple responses to the same question.
* The responses contain factual inaccuracies (Abraham Lincoln was the 16th president, not the 15th).
* The confidence estimate is relatively high (75%) despite the inaccuracies in the responses.
### Interpretation
The diagram illustrates a potential issue with LLMs: they can generate responses that sound plausible but contain factual errors. The high confidence estimate despite the inaccuracies highlights the importance of verifying the information provided by LLMs. The diagram suggests that while LLMs can be useful for generating information, they should not be relied upon without critical evaluation and fact-checking. The presence of multiple responses indicates the LLM's attempt to provide a comprehensive answer, but the variability in accuracy raises concerns about the reliability of the information.