## Chart: Performance Comparison of Hierarchical-3DGS and FLOD-3DGS
### Overview
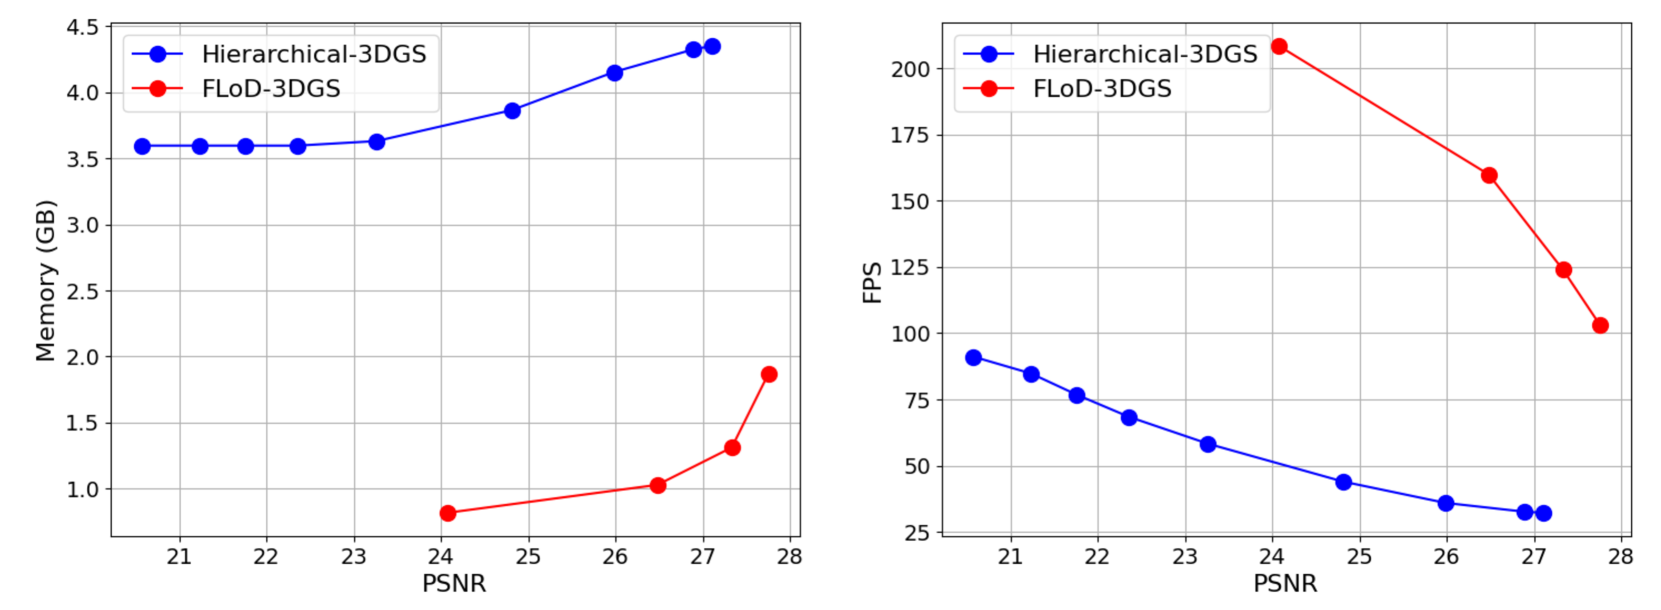
The image presents two line charts comparing the performance of two methods, "Hierarchical-3DGS" and "FLOD-3DGS", based on PSNR (Peak Signal-to-Noise Ratio). The left chart shows memory usage (in GB) versus PSNR, while the right chart shows FPS (Frames Per Second) versus PSNR.
### Components/Axes
**Left Chart:**
* **Title:** Implicitly, Memory Usage vs. PSNR
* **X-axis:** PSNR, with markers at 21, 22, 23, 24, 25, 26, 27, and 28.
* **Y-axis:** Memory (GB), with markers at 1.0, 1.5, 2.0, 2.5, 3.0, 3.5, 4.0, and 4.5.
* **Legend (Top-Left):**
* Blue: Hierarchical-3DGS
* Red: FLOD-3DGS
**Right Chart:**
* **Title:** Implicitly, FPS vs. PSNR
* **X-axis:** PSNR, with markers at 21, 22, 23, 24, 25, 26, 27, and 28.
* **Y-axis:** FPS, with markers at 25, 50, 75, 100, 125, 150, 175, and 200.
* **Legend (Top-Left):**
* Blue: Hierarchical-3DGS
* Red: FLOD-3DGS
### Detailed Analysis
**Left Chart (Memory vs. PSNR):**
* **Hierarchical-3DGS (Blue):** The memory usage remains relatively constant at approximately 3.6 GB for PSNR values between 21 and 23. It then gradually increases to approximately 3.9 GB at PSNR 26, and further increases to approximately 4.4 GB at PSNR 28.
* PSNR 21: ~3.6 GB
* PSNR 23: ~3.6 GB
* PSNR 26: ~3.9 GB
* PSNR 28: ~4.4 GB
* **FLOD-3DGS (Red):** The memory usage is low for PSNR values between 24 and 27, starting at approximately 0.8 GB and increasing to approximately 1.0 GB. It then increases sharply to approximately 1.8 GB at PSNR 28.
* PSNR 24: ~0.8 GB
* PSNR 27: ~1.0 GB
* PSNR 28: ~1.8 GB
**Right Chart (FPS vs. PSNR):**
* **Hierarchical-3DGS (Blue):** The FPS decreases as PSNR increases. It starts at approximately 90 FPS at PSNR 21 and decreases to approximately 30 FPS at PSNR 28.
* PSNR 21: ~90 FPS
* PSNR 24: ~60 FPS
* PSNR 28: ~30 FPS
* **FLOD-3DGS (Red):** The FPS initially increases to a peak of approximately 210 FPS at PSNR 24, then decreases significantly to approximately 100 FPS at PSNR 28.
* PSNR 24: ~210 FPS
* PSNR 27: ~160 FPS
* PSNR 28: ~100 FPS
### Key Observations
* Hierarchical-3DGS has a relatively stable memory footprint but decreasing FPS as PSNR increases.
* FLOD-3DGS has a lower memory footprint than Hierarchical-3DGS, especially at lower PSNR values.
* FLOD-3DGS achieves significantly higher FPS at lower PSNR values but experiences a sharp decline in FPS as PSNR increases.
### Interpretation
The charts illustrate a trade-off between memory usage, FPS, and PSNR for the two methods. Hierarchical-3DGS provides a more consistent performance in terms of memory but sacrifices FPS as PSNR increases. FLOD-3DGS offers higher FPS at lower PSNR values with lower memory usage but suffers a significant drop in FPS as PSNR increases, while also increasing its memory footprint.
The choice between the two methods would depend on the specific application requirements. If memory is a constraint and high FPS is desired at lower PSNR, FLOD-3DGS might be preferred. If a more stable FPS is required and memory is less of a concern, Hierarchical-3DGS might be more suitable.