## Line Graphs: Memory and FPS vs PSNR Comparison
### Overview
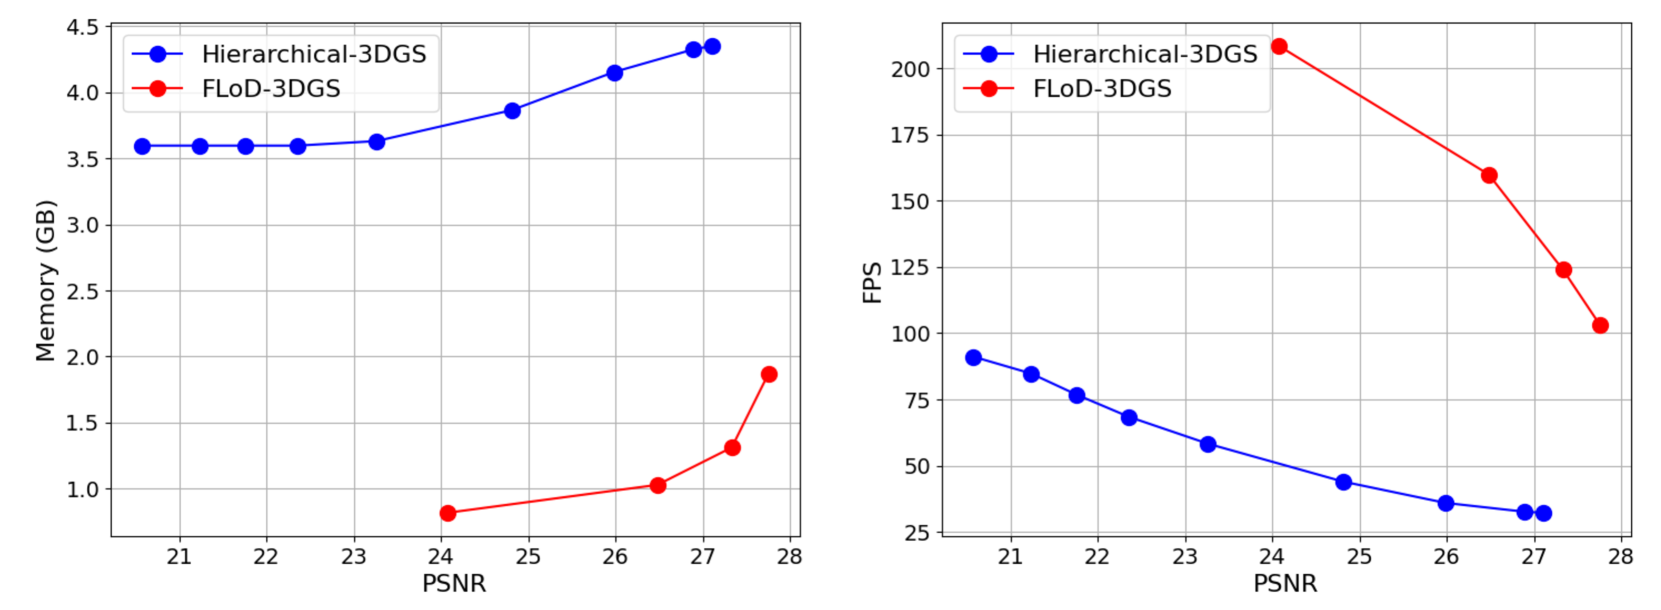
The image contains two side-by-side line graphs comparing performance metrics (Memory in GB and FPS) of two 3D graphics systems, **Hierarchical-3DGS** (blue) and **FLoD-3DGS** (red), across varying Peak Signal-to-Noise Ratio (PSNR) values (21–28). Both graphs use PSNR as the x-axis and distinct performance metrics as the y-axis.
---
### Components/Axes
#### Left Graph: Memory (GB) vs PSNR
- **X-axis (PSNR)**: Ranges from 21 to 28 in integer increments.
- **Y-axis (Memory)**: Scaled from 1.0 to 4.5 GB in 0.5 increments.
- **Legend**:
- Blue circles: **Hierarchical-3DGS**
- Red circles: **FLoD-3DGS**
- **Placement**: Legend in the top-left corner of the graph.
#### Right Graph: FPS vs PSNR
- **X-axis (PSNR)**: Same range (21–28).
- **Y-axis (FPS)**: Scaled from 25 to 200 in 25-unit increments.
- **Legend**: Same as the left graph (blue for Hierarchical-3DGS, red for FLoD-3DGS).
- **Placement**: Legend in the top-left corner.
---
### Detailed Analysis
#### Left Graph: Memory (GB) vs PSNR
- **Hierarchical-3DGS (Blue)**:
- Memory remains **stable at ~3.5–3.6 GB** across all PSNR values (21–28).
- No significant variation observed.
- **FLoD-3DGS (Red)**:
- Data begins at **PSNR 24** with **~0.8 GB**.
- Increases gradually to **~1.3 GB at PSNR 27**.
- Spikes sharply to **~1.8 GB at PSNR 28**.
#### Right Graph: FPS vs PSNR
- **Hierarchical-3DGS (Blue)**:
- Starts at **~90 FPS at PSNR 21**.
- Declines gradually to **~30 FPS at PSNR 27**.
- Slight plateau observed between PSNR 26–27.
- **FLoD-3DGS (Red)**:
- Begins at **200 FPS at PSNR 21**.
- Drops sharply to **175 FPS at PSNR 22**.
- Continues declining steeply to **~10 FPS at PSNR 28**.
---
### Key Observations
1. **Memory Trade-off**:
- Hierarchical-3DGS uses **~3.5–3.6 GB consistently**, while FLoD-3DGS starts lower (~0.8 GB) but increases sharply at higher PSNR values.
2. **FPS Performance**:
- Hierarchical-3DGS maintains **higher FPS** across all PSNR values compared to FLoD-3DGS.
- FLoD-3DGS experiences a **catastrophic FPS drop** after PSNR 22, reaching near-zero performance by PSNR 28.
3. **Anomalies**:
- FLoD-3DGS’s memory usage spikes at PSNR 28 despite FPS collapsing, suggesting a potential inefficiency or resource allocation issue.
---
### Interpretation
- **Hierarchical-3DGS** demonstrates **consistent memory usage** and **gradual FPS degradation**, indicating stable performance with minimal resource variability.
- **FLoD-3DGS** prioritizes **lower memory consumption** initially but suffers from **dramatic FPS loss** as PSNR increases, suggesting a critical trade-off between memory efficiency and computational performance at higher quality settings.
- The **sharp memory spike** in FLoD-3DGS at PSNR 28 (1.8 GB) while FPS collapses to ~10 FPS raises questions about its optimization strategy. This could indicate a design flaw or a deliberate sacrifice of performance for memory savings at extreme PSNR values.
The data highlights a clear divergence in priorities: Hierarchical-3DGS favors **predictable resource usage**, while FLoD-3DGS prioritizes **initial memory efficiency** at the cost of scalability.