## Line Charts: Training Reward vs. Training Steps for GRPO and MEL Models
### Overview
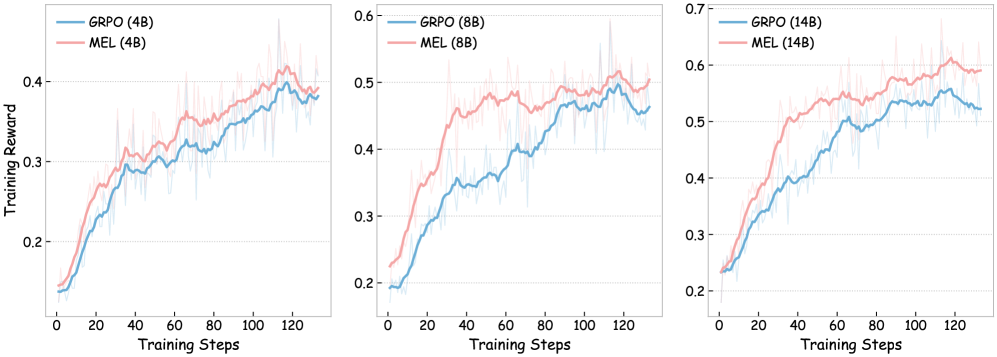
The image presents three line charts comparing the training reward of two models, GRPO and MEL, across different parameter sizes (4B, 8B, and 14B). Each chart plots "Training Reward" on the y-axis against "Training Steps" on the x-axis. The charts show the performance of each model over 120 training steps.
### Components/Axes
* **X-axis (Horizontal):** "Training Steps", ranging from 0 to 120 in increments of 20.
* **Y-axis (Vertical):** "Training Reward", ranging from 0.2 to 0.4 (left), 0.2 to 0.6 (center), and 0.2 to 0.7 (right), with increments of 0.1.
* **Legends (Top-Left of each chart):**
* **Left Chart:** GRPO (4B) (blue), MEL (4B) (pink)
* **Center Chart:** GRPO (8B) (blue), MEL (8B) (pink)
* **Right Chart:** GRPO (14B) (blue), MEL (14B) (pink)
* **Chart Titles:** Implicitly defined by the legend, indicating the model sizes (4B, 8B, 14B).
### Detailed Analysis
**Left Chart: 4B Parameter Size**
* **GRPO (4B) - Blue:** The line starts at approximately 0.15 and generally increases to around 0.38 by step 120. The trend is upward, with some fluctuations.
* **MEL (4B) - Pink:** The line starts at approximately 0.14 and increases to around 0.40 by step 120. The trend is upward, with some fluctuations.
**Center Chart: 8B Parameter Size**
* **GRPO (8B) - Blue:** The line starts at approximately 0.20 and increases to around 0.45 by step 120. The trend is upward, with some fluctuations.
* **MEL (8B) - Pink:** The line starts at approximately 0.20 and increases to around 0.50 by step 120. The trend is upward, with some fluctuations.
**Right Chart: 14B Parameter Size**
* **GRPO (14B) - Blue:** The line starts at approximately 0.20 and increases to around 0.52 by step 120. The trend is upward, with some fluctuations.
* **MEL (14B) - Pink:** The line starts at approximately 0.20 and increases to around 0.60 by step 120. The trend is upward, with some fluctuations.
### Key Observations
* Both GRPO and MEL models show an increase in training reward as the number of training steps increases across all parameter sizes.
* The MEL model generally achieves a higher training reward than the GRPO model for all parameter sizes.
* Increasing the parameter size from 4B to 14B appears to improve the final training reward for both models.
### Interpretation
The charts suggest that both GRPO and MEL models benefit from increased training steps, as evidenced by the upward trend in training reward. The MEL model consistently outperforms the GRPO model, indicating it may be a more effective architecture or training strategy for this particular task. Furthermore, increasing the model size (number of parameters) leads to improved performance, suggesting that the models can better capture the underlying patterns in the data with more capacity. The fluctuations in the lines indicate some variability in the training process, which is typical in machine learning. Overall, the data supports the idea that larger models, trained for longer durations, tend to achieve higher rewards in this context.