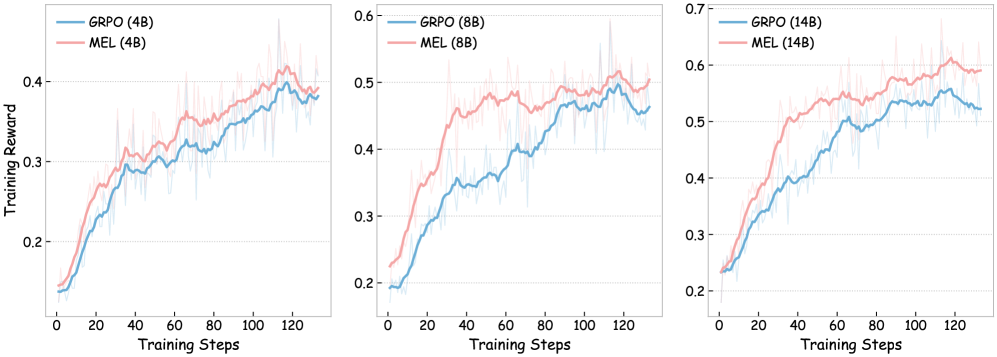
## Line Chart: Training Reward vs. Training Steps for Different Model Sizes
### Overview
The image presents three line charts, each depicting the relationship between "Training Reward" and "Training Steps" for different model sizes. The charts compare the performance of "GRPO" (Generative Reinforcement Policy Optimization) and "MEL" (Maximum Entropy Learning) algorithms. The model sizes are indicated in parentheses after the algorithm name: (4B), (8B), and (14B), representing 4 billion, 8 billion, and 14 billion parameters, respectively. Each chart has a light gray background grid.
### Components/Axes
* **X-axis:** "Training Steps" ranging from 0 to 120.
* **Y-axis:** "Training Reward" ranging from 0.2 to 0.7 (scales vary slightly between charts).
* **Legends:** Each chart has a legend in the top-left corner indicating the two lines:
* Blue Line: "GRPO (4B)", "GRPO (8B)", "GRPO (14B)"
* Red Line: "MEL (4B)", "MEL (8B)", "MEL (14B)"
### Detailed Analysis or Content Details
**Chart 1: Model Size 4B**
* **GRPO (4B) - Blue Line:** The line starts at approximately 0.18 at step 0, increases steadily to around 0.35 at step 40, fluctuates between 0.3 and 0.45, and reaches approximately 0.42 at step 120. There is significant variance around the mean.
* **MEL (4B) - Red Line:** The line starts at approximately 0.22 at step 0, increases to around 0.35 at step 20, then decreases to approximately 0.3 at step 40, and fluctuates between 0.3 and 0.4, reaching approximately 0.38 at step 120. There is significant variance around the mean.
**Chart 2: Model Size 8B**
* **GRPO (8B) - Blue Line:** The line starts at approximately 0.22 at step 0, increases steadily to around 0.4 at step 40, fluctuates between 0.4 and 0.55, and reaches approximately 0.52 at step 120. There is significant variance around the mean.
* **MEL (8B) - Red Line:** The line starts at approximately 0.25 at step 0, increases to around 0.4 at step 20, then increases to approximately 0.5 at step 60, and fluctuates between 0.45 and 0.55, reaching approximately 0.5 at step 120. There is significant variance around the mean.
**Chart 3: Model Size 14B**
* **GRPO (14B) - Blue Line:** The line starts at approximately 0.25 at step 0, increases steadily to around 0.45 at step 40, fluctuates between 0.45 and 0.6, and reaches approximately 0.58 at step 120. There is significant variance around the mean.
* **MEL (14B) - Red Line:** The line starts at approximately 0.28 at step 0, increases to around 0.45 at step 20, then increases to approximately 0.55 at step 60, and fluctuates between 0.5 and 0.6, reaching approximately 0.59 at step 120. There is significant variance around the mean.
### Key Observations
* **General Trend:** Both GRPO and MEL show an increasing trend in training reward as the number of training steps increases.
* **Model Size Impact:** As the model size increases (4B to 8B to 14B), both GRPO and MEL generally achieve higher training rewards.
* **Algorithm Comparison:** MEL consistently outperforms GRPO at the 4B model size. At 8B and 14B, the performance is more comparable, with MEL often slightly outperforming GRPO.
* **Variance:** All lines exhibit significant variance, indicating instability in the training process.
### Interpretation
The data suggests that increasing model size generally leads to improved performance (higher training reward) for both GRPO and MEL algorithms. MEL appears to be more effective than GRPO, particularly at smaller model sizes. The substantial variance in the training reward across all model sizes and algorithms indicates that the training process is sensitive to initial conditions or other stochastic factors. The charts demonstrate the importance of model capacity and algorithm choice in reinforcement learning, and highlight the need for robust training techniques to mitigate variance. The consistent upward trend suggests that continued training would likely yield further improvements in reward, although the variance suggests diminishing returns may be encountered. The fact that the lines do not converge suggests that there is still room for optimization and that the algorithms have not reached their full potential.