## Bar Chart: Accuracy on MMLU
### Overview
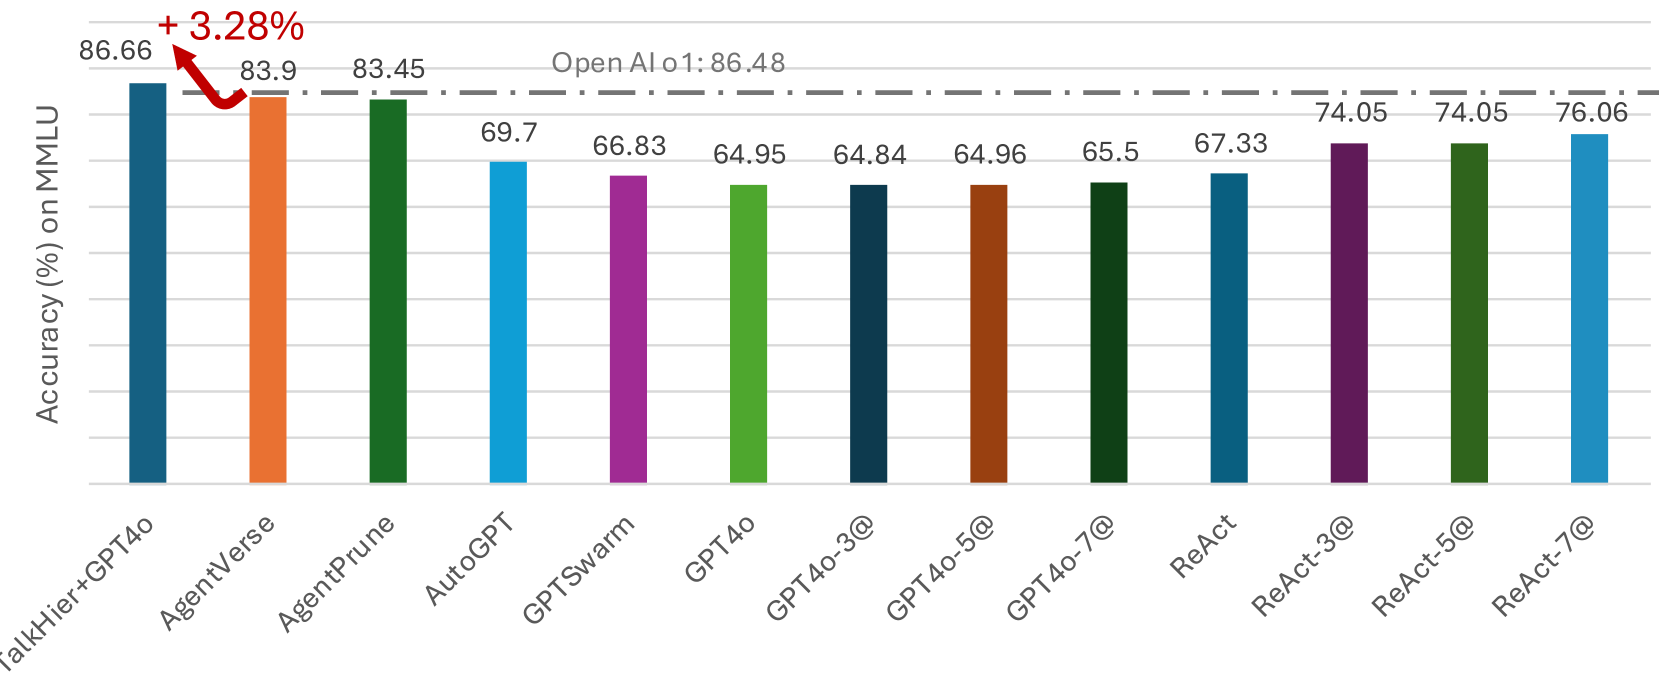
The image is a bar chart comparing the accuracy of different language models on the MMLU (Massive Multitask Language Understanding) benchmark. The y-axis represents accuracy in percentage, and the x-axis lists the names of the models. A horizontal dashed line indicates the performance of "Open AI o1".
### Components/Axes
* **Y-axis:** "Accuracy (%) on MMLU". The scale is not explicitly marked, but the values on top of each bar range from approximately 64 to 87.
* **X-axis:** Categorical axis listing the language models: TalkHier+GPT4o, AgentVerse, AgentPrune, AutoGPT, GPTSwarm, GPT4o, GPT4o-3@, GPT4o-5@, GPT4o-7@, ReAct, ReAct-3@, ReAct-5@, ReAct-7@.
* **Horizontal Line:** A dashed line labeled "Open AI o1: 86.48" runs across the chart, indicating the accuracy of the "Open AI o1" model.
* **Annotation:** "+ 3.28%" with a red arrow pointing from the top of the "TalkHier+GPT4o" bar to the dashed line.
### Detailed Analysis
The chart presents the accuracy of various language models. Here's a breakdown of the values for each model:
* **TalkHier+GPT4o (Dark Blue):** 86.66%
* **AgentVerse (Orange):** 83.9%
* **AgentPrune (Green):** 83.45%
* **AutoGPT (Light Blue):** 69.7%
* **GPTSwarm (Purple):** 66.83%
* **GPT4o (Light Green):** 64.95%
* **GPT4o-3@ (Dark Blue):** 64.84%
* **GPT4o-5@ (Brown):** 64.96%
* **GPT4o-7@ (Dark Green):** 65.5%
* **ReAct (Teal):** 67.33%
* **ReAct-3@ (Purple):** 74.05%
* **ReAct-5@ (Dark Green):** 74.05%
* **ReAct-7@ (Light Blue):** 76.06%
**Trend Verification:**
* The "TalkHier+GPT4o" model has the highest accuracy.
* "AgentVerse" and "AgentPrune" have the second and third highest accuracy, respectively.
* The "GPT4o" variants and "GPTSwarm" have relatively lower accuracy.
* The "ReAct" variants show a moderate level of accuracy.
### Key Observations
* "TalkHier+GPT4o" outperforms all other models, including "Open AI o1", by 3.28%.
* There is a significant performance difference between "TalkHier+GPT4o" and the other models.
* The "GPT4o" variants ("GPT4o-3@", "GPT4o-5@", "GPT4o-7@") have similar accuracy scores.
* The "ReAct" variants ("ReAct-3@", "ReAct-5@", "ReAct-7@") show a slight increase in accuracy with increasing "@" number.
### Interpretation
The chart demonstrates the performance of different language models on the MMLU benchmark. "TalkHier+GPT4o" shows a notable improvement over "Open AI o1", suggesting advancements in model architecture or training techniques. The relatively lower performance of the "GPT4o" variants might indicate the impact of specific configurations or fine-tuning strategies. The "ReAct" models show a gradual improvement, potentially indicating the benefits of increased iterations or complexity in the "ReAct" framework. The data highlights the varying effectiveness of different approaches in achieving high accuracy on the MMLU benchmark.