## Diagram: Network Data Flow with Potential Threat
### Overview
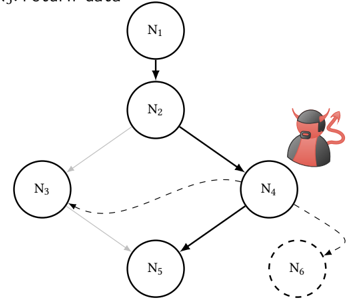
The image depicts a network diagram illustrating the flow of data between nodes (N1 to N6). A malicious actor is positioned near node N4, suggesting a potential security threat or data interception point. The diagram uses arrows to indicate the direction of data flow, with some connections represented by dashed lines, possibly indicating alternative or less secure paths.
### Components/Axes
* **Nodes:** N1, N2, N3, N4, N5, N6 (N6 is represented with a dashed outline)
* **Arrows:** Solid arrows indicate primary data flow. Dashed arrows indicate alternative or less secure data flow. A light gray arrow indicates a specific data flow path.
* **Malicious Actor:** A red devil-like figure positioned near node N4.
### Detailed Analysis
* **Node N1:** Located at the top of the diagram, it has a single outgoing connection to N2.
* **Node N2:** Receives data from N1 and has two outgoing connections: one to N3 (light gray arrow) and one to N4 (solid arrow).
* **Node N3:** Receives data from N2 (light gray arrow) and N4 (dashed arrow).
* **Node N4:** Receives data from N2 (solid arrow) and has two outgoing connections: one to N3 (dashed arrow) and one to N5 (solid arrow). It is also positioned near the malicious actor.
* **Node N5:** Receives data from N4 (solid arrow).
* **Node N6:** Represented with a dashed outline, indicating it may be a potential or compromised node. It receives data from N4 (dashed arrow).
### Key Observations
* The malicious actor is positioned near Node N4, suggesting a potential interception point for data flowing to or from this node.
* The dashed lines from N4 to N3 and N4 to N6 indicate alternative or less secure data paths.
* Node N6 is represented with a dashed outline, suggesting it may be a potential or compromised node.
* The light gray arrow from N2 to N3 indicates a specific data flow path.
### Interpretation
The diagram illustrates a network with potential security vulnerabilities. The presence of a malicious actor near Node N4 suggests a risk of data interception or manipulation. The dashed lines indicate alternative data paths that may be less secure, potentially increasing the risk of compromise. Node N6, represented with a dashed outline, may be a potential target or already compromised node. The diagram highlights the importance of securing Node N4 and monitoring data flow along the dashed lines to mitigate potential security risks.