\n
## Diagram: Network Flow with Anomalies
### Overview
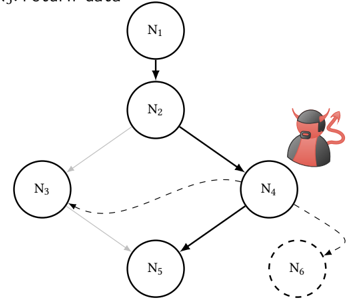
The image depicts a directed graph representing a network flow between six nodes (N1 through N6). The connections between nodes are indicated by arrows, with varying line styles (solid and dashed) suggesting different types of relationships or strengths. A cartoonish devil figure is positioned near node N4, and node N6 is enclosed in a dashed circle, indicating potential anomalies or points of interest.
### Components/Axes
The diagram consists of six nodes labeled N1, N2, N3, N4, N5, and N6. The connections between these nodes are represented by directed edges (arrows). There are no explicit axes or scales. The diagram also includes a visual element of a devil character and a dashed circle around N6.
### Detailed Analysis or Content Details
The network flow can be described as follows:
* **N1 -> N2:** A solid arrow indicates a direct flow from node N1 to node N2.
* **N2 -> N4:** A solid arrow indicates a direct flow from node N2 to node N4.
* **N2 -> N5:** A solid arrow indicates a direct flow from node N2 to node N5.
* **N3 -> N2:** A solid arrow indicates a direct flow from node N3 to node N2.
* **N3 -> N4:** A dashed arrow indicates a flow from node N3 to node N4.
* **N4 -> N6:** A dashed arrow indicates a flow from node N4 to node N6.
* **N5 -> N4:** A solid arrow indicates a flow from node N5 to node N4.
The devil figure is positioned to the right of node N4, seemingly observing or influencing the flow. Node N6 is enclosed in a dashed circle, visually separating it from the other nodes. The arrow pointing to N6 is also dashed.
### Key Observations
* Node N4 appears to be a central hub, receiving input from N2, N3, and N5.
* The dashed lines suggest weaker or less direct connections compared to the solid lines.
* The presence of the devil figure near N4 and the dashed circle around N6 suggest these elements are potentially problematic or require further investigation.
* N6 is only reached via a dashed line from N4.
### Interpretation
This diagram likely represents a system or process where data or resources flow between different components (nodes). The solid and dashed lines could represent different levels of trust, security, or reliability in the connections. The devil figure near N4 suggests that this node might be a source of malicious activity or a point of vulnerability. The dashed circle around N6 indicates that this node is potentially compromised, anomalous, or requires special attention.
The diagram could be illustrating a security threat model, a data flow diagram with potential vulnerabilities, or a network topology with identified risks. The use of visual cues like the devil and the dashed circle emphasizes the importance of monitoring and securing nodes N4 and N6. The flow from N3 to N4 is also dashed, suggesting a less reliable or secure connection. The overall structure suggests a system where information flows from initial nodes (N1, N3) through a central hub (N4) to a potentially vulnerable endpoint (N6).