\n
## Line Chart: Test Result on Minerva MATH
### Overview
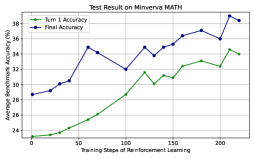
This image presents a line chart illustrating the performance of a model on the Minerva MATH dataset, specifically tracking "Turn 1 Accuracy" and "Final Accuracy" as a function of "Training Steps of Reinforcement Learning". The chart displays how these accuracy metrics evolve over approximately 200 training steps.
### Components/Axes
* **Title:** "Test Result on Minerva MATH" (positioned at the top-center)
* **X-axis:** "Training Steps of Reinforcement Learning" (ranging from approximately 0 to 210, with markers at 0, 50, 100, 150, and 200).
* **Y-axis:** "% Average human-like solution selecting" (ranging from approximately 20% to 38%, with markers at 20, 22, 24, 26, 28, 30, 32, 34, 36, and 38).
* **Legend:** Located in the top-left corner, identifying two data series:
* "Turn 1 Accuracy" (represented by a green line with triangle markers)
* "Final Accuracy" (represented by a blue line with circle markers)
### Detailed Analysis
**Turn 1 Accuracy (Green Line):**
The green line representing "Turn 1 Accuracy" shows an overall upward trend, starting at approximately 20% at 0 training steps. It gradually increases to around 32% at 150 training steps, with some fluctuations. At 200 training steps, it reaches approximately 34%.
* 0 steps: ~20%
* 50 steps: ~23%
* 100 steps: ~28%
* 150 steps: ~32%
* 200 steps: ~34%
**Final Accuracy (Blue Line):**
The blue line representing "Final Accuracy" exhibits a more volatile pattern. It begins at approximately 28% at 0 training steps, rises to a peak of around 35% at 50 steps, then dips to approximately 32% at 100 steps. It then increases again, reaching a maximum of approximately 37% at 150 steps, before decreasing to around 36% at 200 steps.
* 0 steps: ~28%
* 50 steps: ~35%
* 100 steps: ~32%
* 150 steps: ~37%
* 200 steps: ~36%
### Key Observations
* Both accuracy metrics generally improve with increasing training steps, but "Final Accuracy" demonstrates greater variability.
* "Final Accuracy" initially outperforms "Turn 1 Accuracy", but the gap narrows as training progresses.
* There appears to be a plateauing effect for both metrics after 150 training steps.
* The "Final Accuracy" line shows a local maximum around 50 steps and another around 150 steps, suggesting periods of rapid learning followed by consolidation or adjustment.
### Interpretation
The chart suggests that the model's performance on the Minerva MATH dataset improves with reinforcement learning, as evidenced by the increasing accuracy metrics. The difference between "Turn 1 Accuracy" and "Final Accuracy" indicates that the model refines its solutions over multiple turns. The fluctuations in "Final Accuracy" could be attributed to the complexity of the dataset, the stochastic nature of reinforcement learning, or the model's exploration of different solution strategies. The plateauing effect after 150 steps might suggest that the model is approaching its performance limit or that further training requires adjustments to the learning parameters. The data suggests that the model is learning to provide more human-like solutions, but there is still room for improvement. The initial peak in "Final Accuracy" at 50 steps could represent a quick initial gain in performance, followed by a period of refinement and stabilization. The subsequent peak at 150 steps suggests a second phase of learning and improvement.