## Network Diagram: Interconnected Nodes
### Overview
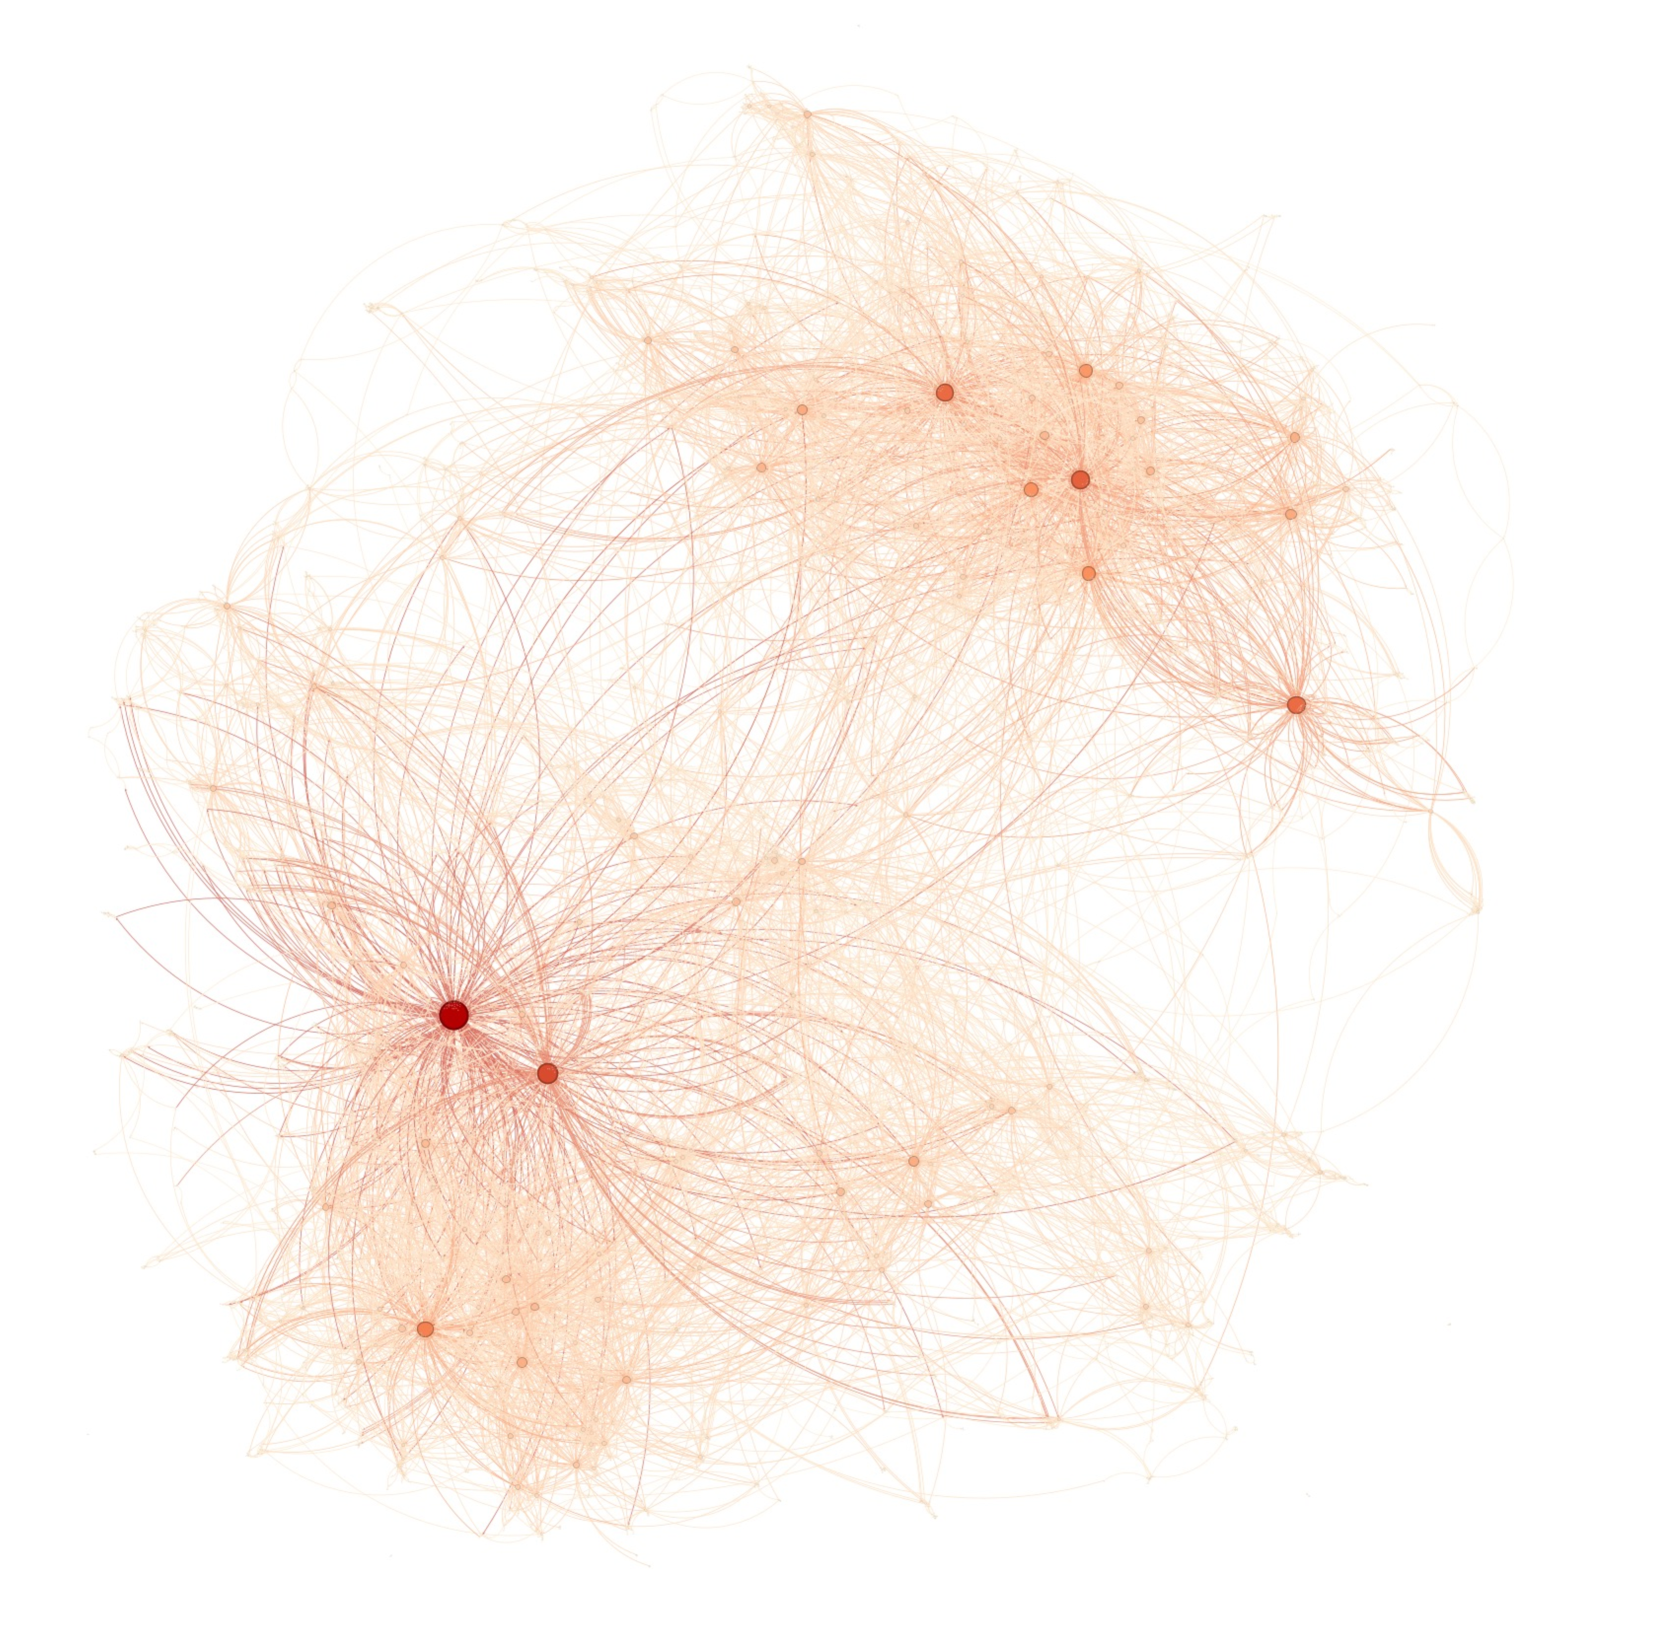
The image is a network diagram showing interconnected nodes. The nodes are represented by circles, and the connections between them are represented by curved lines. The color of the nodes and lines varies from light orange to dark red, potentially indicating the strength or frequency of the connection.
### Components/Axes
* **Nodes:** Represented by circles of varying sizes and colors.
* **Connections:** Represented by curved lines of varying thickness and colors, linking the nodes.
* **Color Gradient:** The color of the nodes and lines ranges from light orange to dark red.
### Detailed Analysis
* **Node Distribution:** The nodes are clustered in several distinct regions, with some nodes acting as central hubs connecting multiple clusters.
* **Connection Density:** The density of connections varies across the diagram, with some regions having a high concentration of lines and others being more sparse.
* **Color Variation:** The color of the nodes and lines appears to correlate with the number of connections a node has. Darker red nodes seem to have more connections than lighter orange nodes.
* **Hub Nodes:** There are a few prominent nodes that are significantly larger and darker red than the others. These nodes act as central hubs, with many connections radiating from them. One such hub is located in the bottom-left quadrant of the image, and another is in the upper-center.
### Key Observations
* The network exhibits a clustered structure, with some nodes acting as central hubs.
* The color gradient suggests a correlation between the number of connections and the color intensity of the nodes and lines.
* The diagram lacks explicit labels or a legend, making it difficult to determine the exact meaning of the nodes, connections, and color gradient.
### Interpretation
The network diagram likely represents a complex system of relationships between different entities. The nodes could represent individuals, organizations, concepts, or any other type of entity, while the connections represent the relationships between them. The color gradient could indicate the strength, frequency, or importance of these relationships.
The clustered structure of the network suggests that the entities are grouped into distinct communities or categories. The central hubs represent influential entities that play a key role in connecting these communities.
Without additional information, it is difficult to determine the specific meaning of the diagram. However, the visual representation provides valuable insights into the structure and dynamics of the underlying system.