## [Diagram Type]: Network Graph / Node-Link Diagram
### Overview
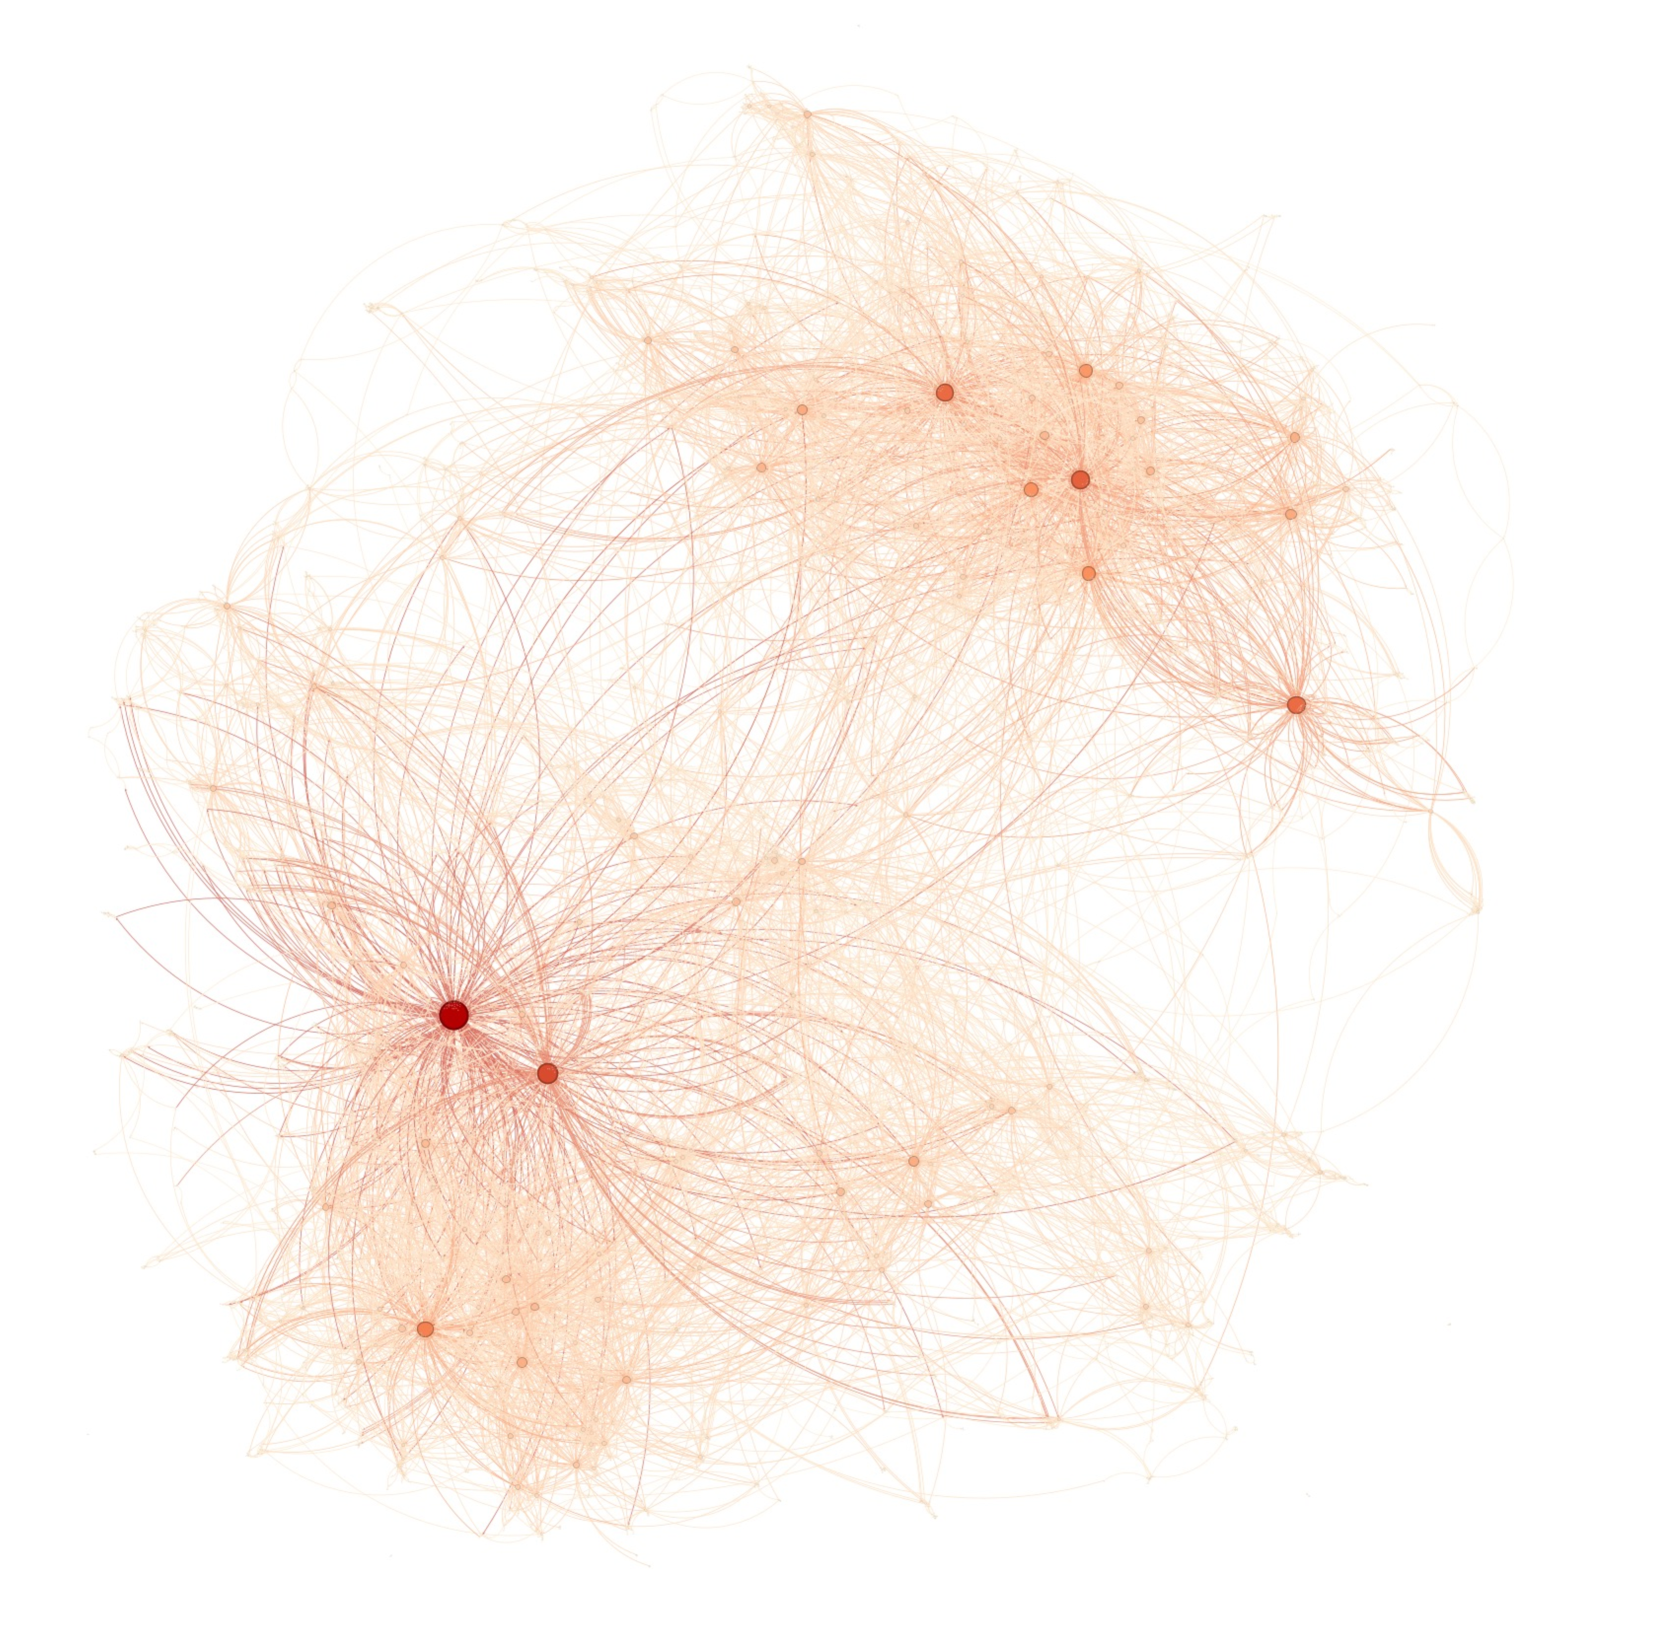
This image is a visualization of a complex network, commonly referred to as a node-link diagram or a force-directed graph. It depicts a system of interconnected entities (nodes) and their relationships (edges). The graph is presented on a plain white background. There is no textual information, axis, legend, or title provided in the image. The visualization relies entirely on spatial positioning, node size, and color intensity to convey the structure of the network.
### Components/Axes
* **Axes:** None. This is a non-Cartesian coordinate system; the spatial arrangement is determined by a force-directed layout algorithm rather than fixed X/Y axes.
* **Nodes:** Represented as circles. The size and color intensity of the nodes vary.
* **Color/Size Scale:** Ranges from light, small, translucent orange circles to large, opaque, deep red circles.
* **Edges:** Represented as thin, curved lines connecting the nodes. The lines are generally light orange, becoming slightly more visible where they cluster near high-density nodes.
* **Legend:** None.
### Detailed Analysis
The graph can be segmented into two primary regions of activity, connected by a web of secondary relationships.
* **Region 1 (Left/Bottom-Left Cluster):**
* **Visual Trend:** This region is the most dense. It is dominated by a single, very large, dark red node (the "Super-Hub").
* **Connectivity:** This Super-Hub acts as a central point of convergence, with a vast number of edges radiating outward to smaller, lighter-colored nodes.
* **Secondary Hubs:** Immediately adjacent to the Super-Hub (slightly to the right and down) is a secondary, smaller red node, which also acts as a local hub.
* **Region 2 (Top-Right Cluster):**
* **Visual Trend:** This region is more diffuse and spread out compared to the left cluster.
* **Connectivity:** It contains several medium-sized red nodes rather than one single dominant hub. These nodes are interconnected with each other and with the surrounding smaller nodes.
* **Structure:** This cluster appears to represent a more distributed or decentralized sub-network compared to the highly centralized structure on the left.
* **Inter-Cluster Connectivity:**
* There is a visible "bridge" of edges connecting the left cluster to the right cluster. These lines are sparse compared to the intra-cluster density, suggesting that while the two groups are related, they operate with a degree of separation.
### Key Observations
* **Centralization:** The network is highly centralized. The large red node on the left is the clear outlier in terms of "degree centrality" (the number of connections).
* **Topology:** The graph exhibits characteristics of a "scale-free" network, where a few nodes (hubs) have a disproportionately high number of connections compared to the majority of nodes.
* **Visual Hierarchy:** The color gradient (light orange to deep red) and node size are positively correlated. The deeper the red, the higher the centrality or "importance" of that node within the network.
### Interpretation
This diagram demonstrates the structural topology of a complex system. Without labels, the specific subject matter (e.g., social media interactions, biological protein-protein interactions, or computer network traffic) is unknown, but the *behavior* of the system is clear:
* **Dependency:** The system is heavily dependent on the "Super-Hub" on the left. If this node were removed, the connectivity of the left cluster would likely collapse.
* **Communication Flow:** The density of lines suggests that information or influence flows rapidly within the clusters, but the flow between the two clusters is more restricted, passing through a limited number of "bridge" nodes.
* **System Resilience:** The right cluster, being more decentralized, likely possesses higher resilience to the failure of any single node, whereas the left cluster is fragile due to its reliance on the central Super-Hub.
In a Peircean sense, the diagram acts as an *icon* of a hierarchy. It visually argues that the system is not egalitarian; it is structured around power centers (hubs) that dictate the flow and organization of the entire network.