\n
## Network Diagram: Interconnected Nodes
### Overview
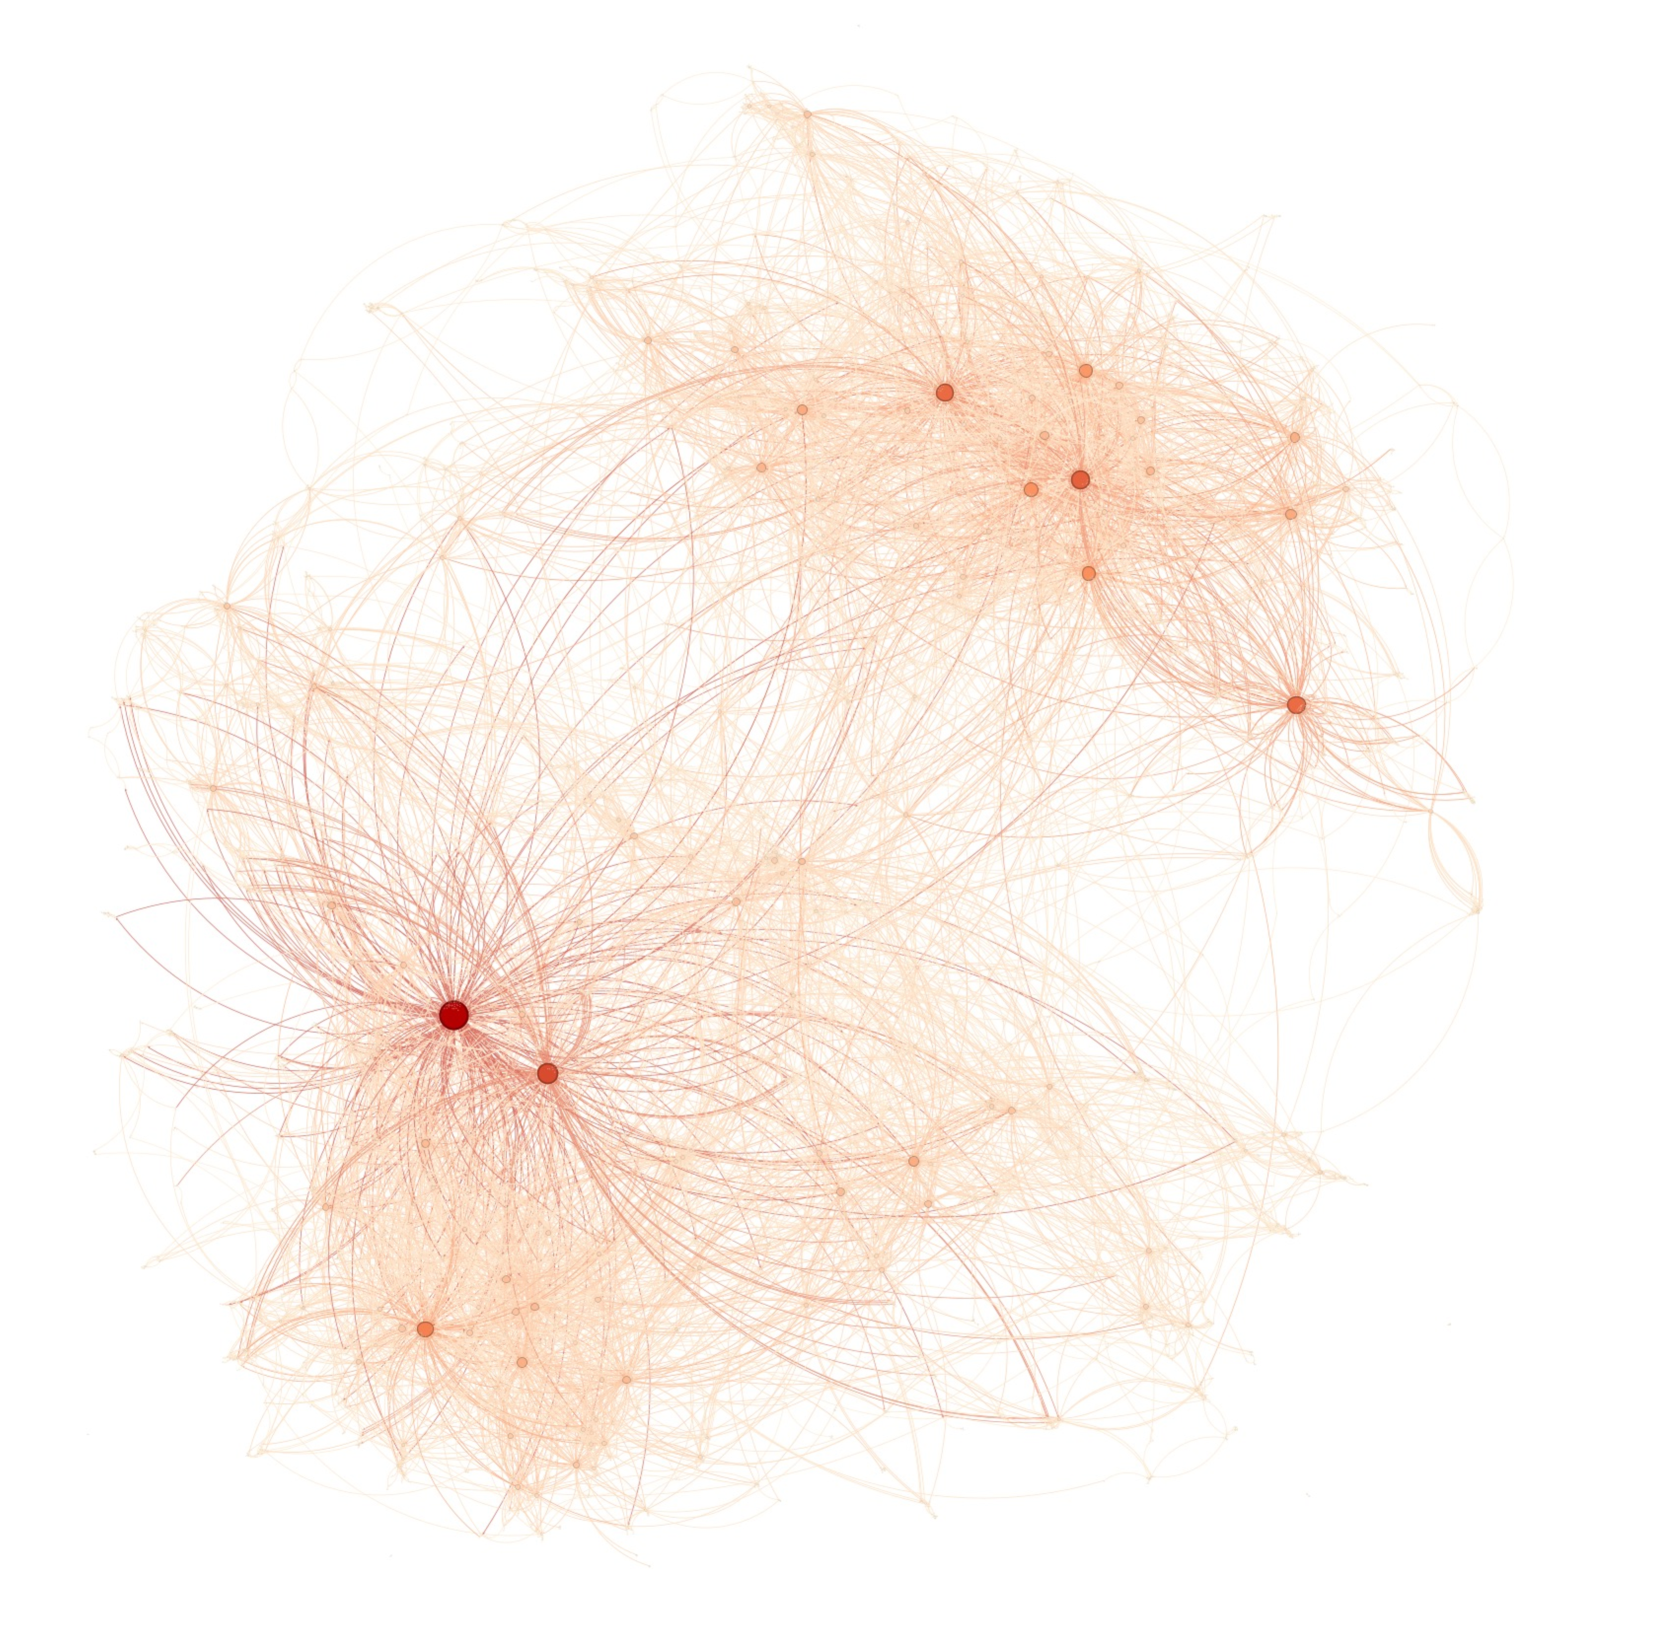
The image presents a network diagram visualizing relationships between numerous nodes. The diagram consists of a large number of interconnected points (nodes) linked by curved lines (edges). The nodes vary in size, likely representing the importance or degree of connection of each node. The overall structure appears somewhat circular, with denser clusters of nodes in certain areas and sparser connections elsewhere. There are no explicit labels, axes, or legends present in the image.
### Components/Axes
There are no axes or explicit labels. The diagram consists solely of nodes and edges. Node size appears to correlate with connectivity. The edges are curved, suggesting a non-Euclidean or force-directed layout. The color scheme is monochromatic, using shades of orange/red.
### Detailed Analysis or Content Details
Due to the lack of labels and quantitative data, a precise numerical analysis is impossible. However, we can describe the distribution and characteristics of the network:
* **Node Count:** Approximately 200-300 nodes are visible.
* **Edge Count:** The number of edges is significantly higher than the node count, indicating a highly connected network. It's difficult to estimate precisely, but likely exceeds 500-800.
* **Node Size Distribution:** Node sizes vary considerably. There are a few relatively large nodes (approximately 5-10 with diameters of ~5-10 pixels), many medium-sized nodes (diameter ~2-5 pixels), and a large number of small nodes (diameter < 2 pixels).
* **Cluster Identification:** Three main clusters are discernible:
* **Bottom-Center Cluster:** This is the most densely connected cluster, with a large central node and numerous connections radiating outwards.
* **Top-Left Cluster:** A less dense cluster, but still exhibiting significant internal connectivity.
* **Top-Right Cluster:** A smaller, more isolated cluster.
* **Edge Density:** Edge density is highest within the bottom-center cluster and lower in the other two clusters. The edges are distributed relatively evenly within each cluster, but there are fewer connections *between* clusters.
* **Edge Curvature:** The edges are consistently curved, creating a visually organic and flowing network structure.
### Key Observations
* The network exhibits a clear hierarchical structure, with a few central nodes acting as hubs and many peripheral nodes connected to them.
* The bottom-center cluster appears to be the most influential or important part of the network.
* The top-right cluster is relatively isolated, suggesting it may represent a distinct sub-network or a less integrated component.
* The lack of labels makes it impossible to determine the meaning of the nodes and edges.
### Interpretation
The diagram likely represents a complex system of relationships, such as a social network, a communication network, or a biological network. The varying node sizes suggest that some entities within the system are more important or have more connections than others. The clusters indicate the presence of distinct groups or communities within the network. The overall structure suggests a degree of centralization, with a few key nodes playing a critical role in connecting the rest of the network.
Without additional information, it is difficult to draw more specific conclusions. However, the diagram provides a valuable visual representation of the network's structure and connectivity, which could be used to identify key players, understand the flow of information, or detect potential vulnerabilities. The absence of labels is a significant limitation, but the visual patterns themselves offer insights into the underlying relationships. The diagram is a qualitative visualization, and further analysis would require quantitative data and contextual information.