## Network Diagram: Abstract Connectivity Web
### Overview
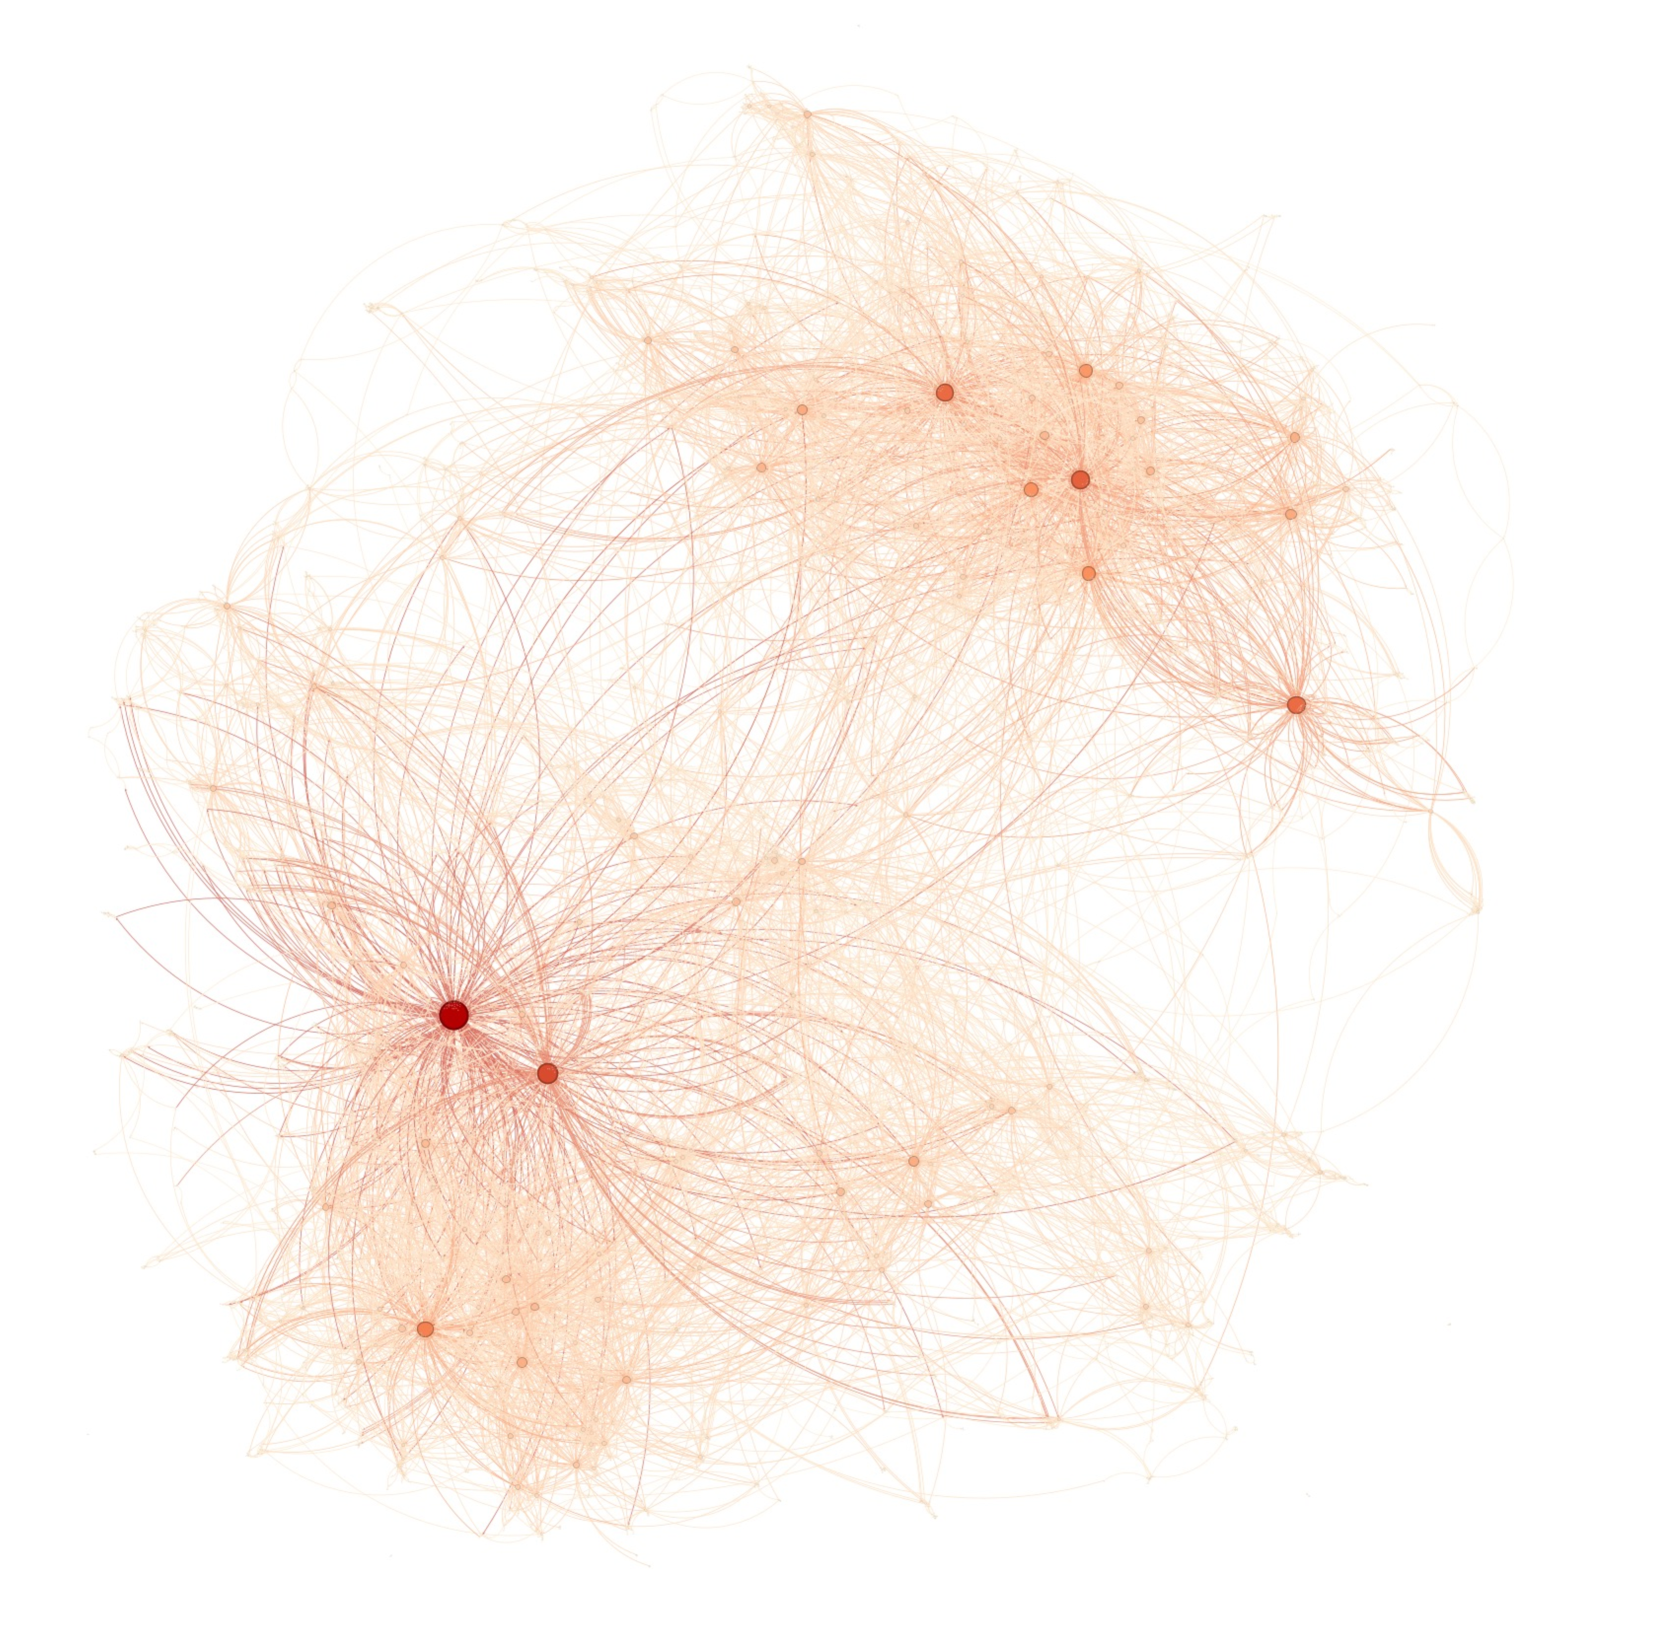
The image depicts a complex network of interconnected nodes and pathways. Nodes are represented as red circular points, while connections are thin, light-colored lines forming a dense, web-like structure. The layout is organic, with no rigid geometric constraints, suggesting a dynamic or emergent system.
### Components/Axes
- **Nodes**: Red circular points scattered throughout the diagram.
- **Connections**: Thin, light-colored lines linking nodes.
- **No explicit labels, legends, or axis markers** are present.
- **No numerical scales, categories, or textual annotations** are visible.
### Detailed Analysis
- **Node Distribution**:
- Nodes are unevenly distributed, with clusters in the upper-right and lower-left regions.
- A central node (bright red) acts as a focal point, radiating connections to surrounding nodes.
- Smaller nodes (darker red) are dispersed in peripheral areas, with fewer connections.
- **Connection Density**:
- High-density regions (e.g., upper-right cluster) show overlapping lines, creating a "hairball" effect.
- Lower-density areas (e.g., lower-left) have sparser, more isolated connections.
- **Color Gradient**:
- Nodes transition from bright red (central) to darker red (peripheral), possibly indicating hierarchy or activity level.
- Lines are uniformly light beige, with no variation in thickness or color.
### Key Observations
1. **Central Hub**: The bright red node in the lower-left quadrant dominates the network, suggesting a primary node or hub.
2. **Clustered Regions**: The upper-right cluster exhibits the highest connection density, implying a sub-network or community.
3. **Peripheral Isolation**: Nodes in the lower-right and upper-left corners have minimal connections, indicating potential outliers or isolated components.
4. **No Textual Elements**: No labels, legends, or axis titles are present, limiting direct interpretation of node identities or relationships.
### Interpretation
This diagram likely represents a network analysis of a system with hierarchical or community-based structures. The central hub and clustered regions suggest key nodes or groups with high interconnectivity, while peripheral nodes may represent less critical or isolated elements. The absence of labels or legends prevents definitive identification of nodes or their roles. The organic layout implies a focus on relational dynamics rather than quantitative metrics.
**Note**: The image contains no textual information, numerical data, or explicit labels. All interpretations are based on visual patterns and spatial relationships.