## Line Graphs: Attention Norms Across Epochs in Layer 2 and Layer 12
### Overview
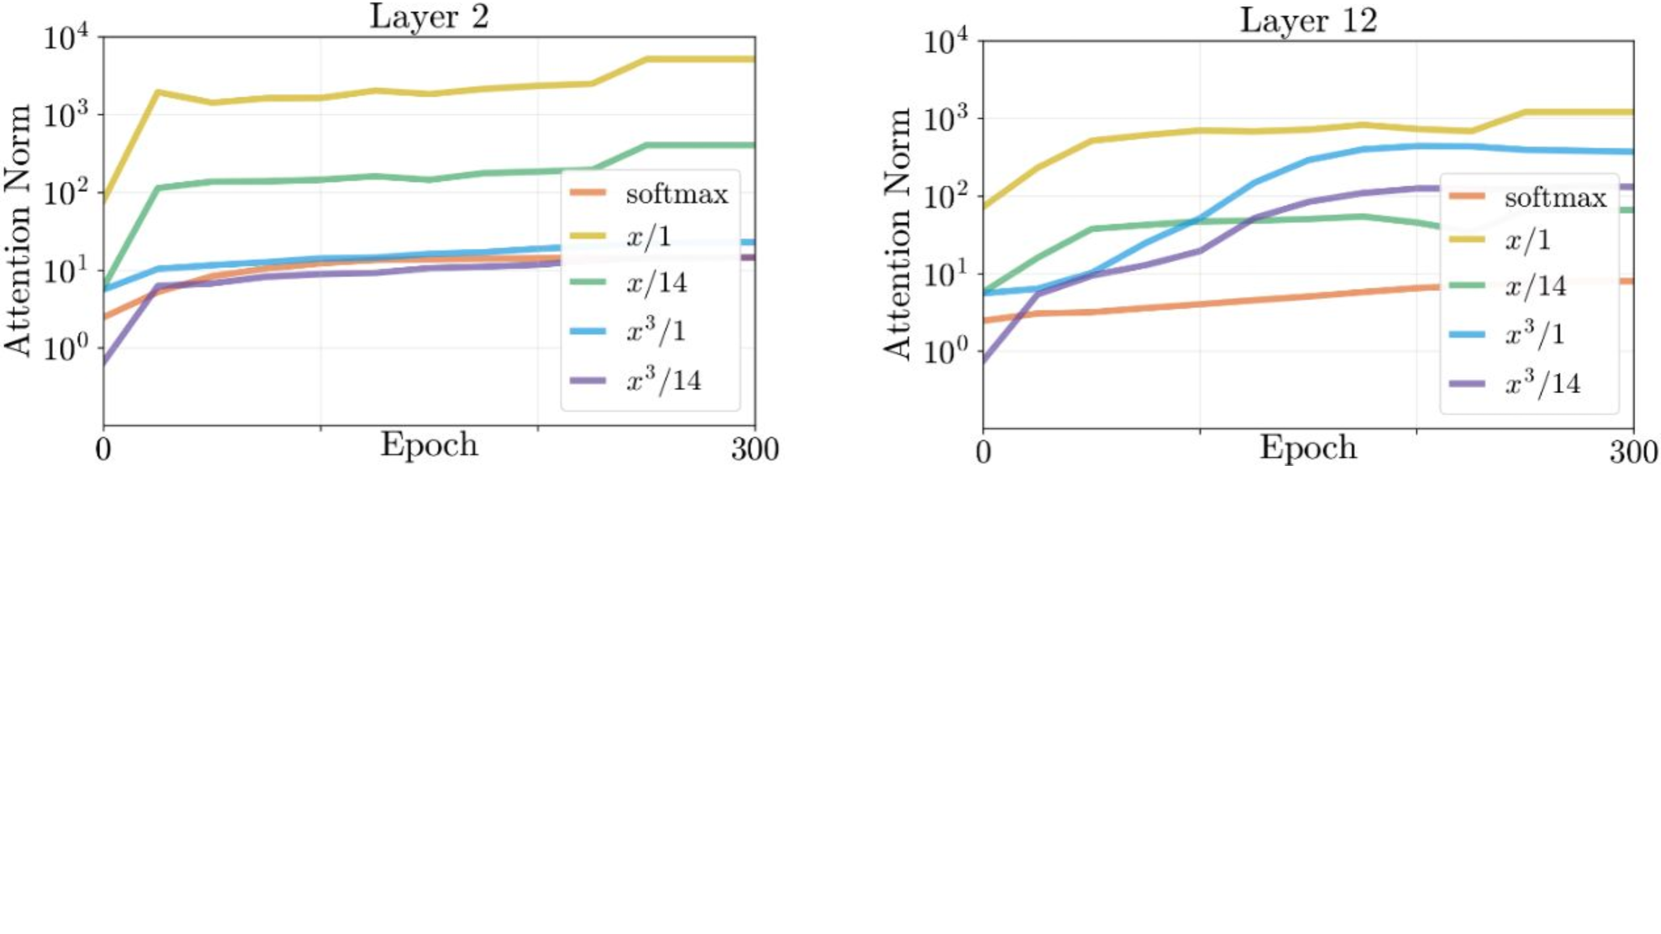
The image contains two line graphs comparing the evolution of "Attention Norm" across 300 epochs for different normalization methods in neural network layers (Layer 2 and Layer 12). The y-axis uses a logarithmic scale (10⁰ to 10⁴), and the x-axis represents training epochs (0–300). Five methods are compared: softmax, x/1, x/14, x³/1, and x³/14.
### Components/Axes
- **X-axis (Epoch)**: Ranges from 0 to 300, labeled "Epoch."
- **Y-axis (Attention Norm)**: Logarithmic scale (10⁰ to 10⁴), labeled "Attention Norm."
- **Legends**: Positioned at the bottom-right of each graph, with color-coded labels:
- **softmax**: Orange
- **x/1**: Yellow
- **x/14**: Green
- **x³/1**: Blue
- **x³/14**: Purple
### Detailed Analysis
#### Layer 2
- **softmax (orange)**: Starts at ~10⁰, rises sharply to ~10³ by epoch 50, then plateaus.
- **x/1 (yellow)**: Begins at ~10¹, remains stable around ~10³ after epoch 50.
- **x/14 (green)**: Starts at ~10⁰, increases gradually to ~10², then stabilizes.
- **x³/1 (blue)**: Begins at ~10⁰, rises steadily to ~10¹ by epoch 300.
- **x³/14 (purple)**: Starts at ~10⁻¹, increases slowly to ~10⁰ by epoch 300.
#### Layer 12
- **softmax (orange)**: Starts at ~10⁰, rises to ~10² by epoch 100, then plateaus.
- **x/1 (yellow)**: Begins at ~10¹, remains stable around ~10³ after epoch 50.
- **x/14 (green)**: Starts at ~10⁰, increases to ~10¹, then stabilizes.
- **x³/1 (blue)**: Begins at ~10⁰, rises sharply to ~10² by epoch 200, then plateaus.
- **x³/14 (purple)**: Starts at ~10⁻¹, increases to ~10¹ by epoch 300.
### Key Observations
1. **Layer 12 vs. Layer 2**: Layer 12 consistently shows higher attention norms across all methods, especially for x³/1 and x³/14.
2. **x³/1 Dominance**: In Layer 12, x³/1 achieves the highest norms (~10³), suggesting stronger scaling in deeper layers.
3. **softmax Adaptation**: softmax norms grow significantly in Layer 12 (~10² vs. ~10³ in Layer 2), indicating layer-specific adjustments.
4. **x/14 Consistency**: x/14 remains the lowest-performing method in both layers, with minimal growth.
### Interpretation
The data suggests that deeper layers (Layer 12) require stronger normalization (e.g., x³/1) to maintain high attention norms, likely due to increased complexity. The softmax method adapts better in deeper layers, possibly reflecting dynamic adjustments. The x/14 method’s stagnation implies insufficient scaling for deeper networks. These trends highlight the importance of method selection based on layer depth and network architecture.