\n
## Diagram: Equivalent Representations of a System
### Overview
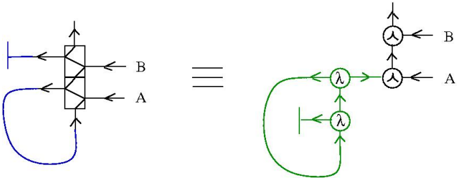
The image presents two different graphical representations of the same system, indicating their equivalence. The left side shows a block diagram with a rectangular block and input/output lines, while the right side depicts a signal flow diagram with summation junctions and feedback loops. A triple equals sign (=) connects the two representations, signifying their functional equivalence.
### Components/Axes
The diagram does not have traditional axes. Instead, it features:
* **Block Diagram (Left):** A rectangular block with input labeled "A" and output labeled "B". Lines represent signal flow. A feedback loop is present, originating from the output and returning to the input.
* **Signal Flow Diagram (Right):** Summation junctions (circles with a cross inside) and directed arrows representing signal flow. A feedback loop is also present, originating from the output and returning to the input.
* **Labels:** "A" and "B" are used to label the input and output signals, respectively. The symbol "λ" (lambda) appears within the signal flow diagram.
* **Color Coding:** The block diagram uses blue lines, while the signal flow diagram uses green lines.
### Detailed Analysis or Content Details
**Block Diagram (Left):**
* Input A enters the block from the right.
* Input B enters the block from the top.
* Output B exits the block from the top.
* A feedback loop originates from the output B, loops around the block, and enters the block from the bottom.
**Signal Flow Diagram (Right):**
* Input A enters a summation junction.
* Input B enters the same summation junction.
* The output of the summation junction feeds into another summation junction.
* A feedback loop originates from the output of the second summation junction, passes through a component labeled "λ", and returns to the first summation junction.
* Another input enters the first summation junction, originating from the left. This input is also passed through a component labeled "λ".
### Key Observations
The two diagrams represent the same system functionality but use different graphical conventions. The block diagram is a more abstract representation, while the signal flow diagram provides a more detailed view of the signal paths and summation points. The "λ" symbol likely represents a gain or transfer function within the system. The color coding (blue vs. green) visually separates the two representations.
### Interpretation
This diagram illustrates the concept of equivalent representations in system modeling. The block diagram and signal flow diagram are two ways to describe the same system's behavior. The signal flow diagram breaks down the block diagram into its fundamental components: signal addition and feedback. This is a common practice in control systems engineering and signal processing, where different representations are used to analyze and design systems. The presence of the "λ" symbol suggests that the system includes gain elements, which are crucial for understanding the system's response to inputs. The equivalence indicated by the triple equals sign implies that both diagrams accurately predict the system's output for any given input. The diagram is not providing numerical data, but rather a conceptual equivalence.