\n
## Bar Chart: Number of Tokens After First Step vs. Pass@1 of qτ
### Overview
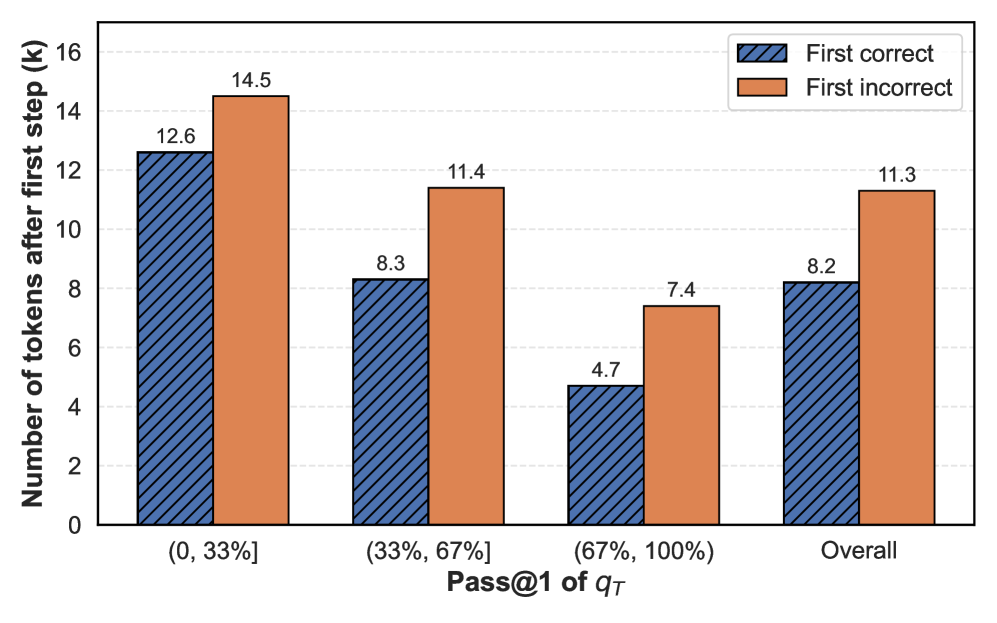
This bar chart compares the number of tokens generated after the first step for "First correct" and "First incorrect" scenarios, categorized by the Pass@1 of qτ. Pass@1 of qτ represents the percentage of times the correct answer is within the top 1 prediction. The chart displays the average number of tokens (in thousands, 'k') generated in each category.
### Components/Axes
* **X-axis:** Pass@1 of qτ, with categories: "(0, 33%)", "(33%, 67%)", "(67%, 100%)", and "Overall".
* **Y-axis:** Number of tokens after first step (k), ranging from 0 to 16.
* **Legend:**
* "First correct" - represented by a dark blue, hatched bar.
* "First incorrect" - represented by a light orange, hatched bar.
* **Data Labels:** Each bar has a numerical label indicating the corresponding value.
### Detailed Analysis
The chart consists of four sets of paired bars, one for each Pass@1 of qτ category.
* **(0, 33%):**
* "First correct": Approximately 12.6 k tokens. The bar slopes upward.
* "First incorrect": Approximately 14.5 k tokens. The bar slopes upward.
* **(33%, 67%):**
* "First correct": Approximately 8.3 k tokens. The bar slopes upward.
* "First incorrect": Approximately 11.4 k tokens. The bar slopes upward.
* **(67%, 100%):**
* "First correct": Approximately 4.7 k tokens. The bar slopes upward.
* "First incorrect": Approximately 7.4 k tokens. The bar slopes upward.
* **Overall:**
* "First correct": Approximately 8.2 k tokens. The bar slopes upward.
* "First incorrect": Approximately 11.3 k tokens. The bar slopes upward.
### Key Observations
* The "First incorrect" bars are consistently higher than the "First correct" bars across all Pass@1 of qτ categories.
* As the Pass@1 of qτ increases (from 0-33% to 67-100%), the number of tokens generated for both "First correct" and "First incorrect" generally decreases.
* The largest difference between "First correct" and "First incorrect" occurs in the (0, 33%) category, with a difference of approximately 1.9 k tokens.
* The smallest difference between "First correct" and "First incorrect" occurs in the Overall category, with a difference of approximately 3.1 k tokens.
### Interpretation
The data suggests that when the model's initial prediction is less accurate (lower Pass@1 of qτ), it tends to generate more tokens before either arriving at the correct answer or determining that the initial attempt was incorrect. This is reflected in the higher token counts for "First incorrect" in the lower Pass@1 ranges. The decreasing token count as Pass@1 increases indicates that more accurate initial predictions lead to faster convergence to a solution. The overall difference between correct and incorrect first steps suggests that the model requires more tokens when it initially makes an incorrect prediction, even when considering all cases. This could be due to the model needing to explore more possibilities or correct its course after an initial misstep. The chart provides insight into the efficiency of the model's reasoning process based on the quality of its initial predictions.