## Grouped Bar Chart: Token Count After First Step by Pass@1 Accuracy
### Overview
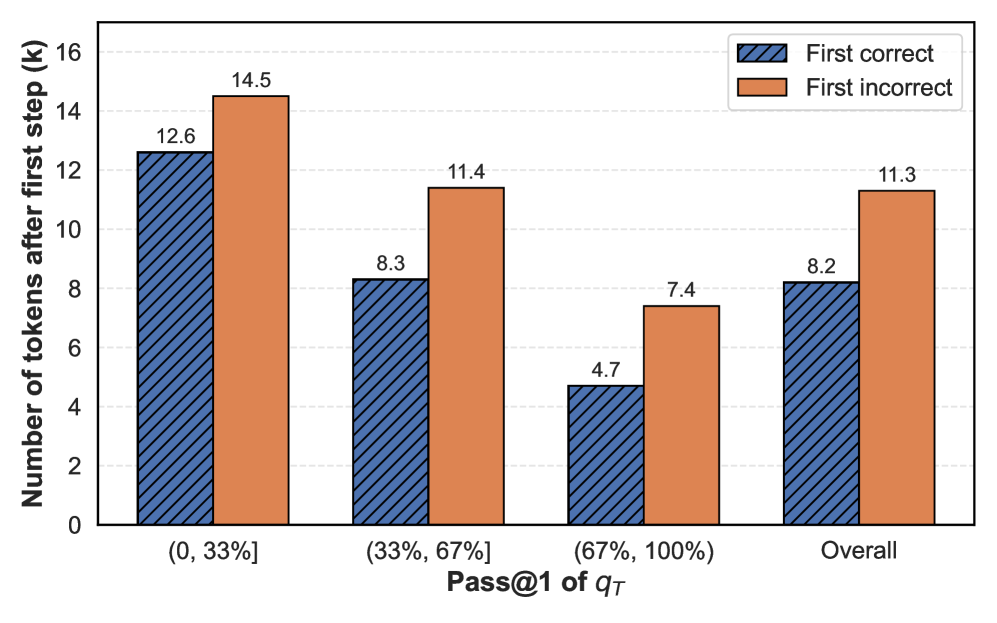
This is a grouped bar chart comparing the average number of tokens generated after the first step for two outcomes ("First correct" and "First incorrect") across different ranges of Pass@1 accuracy for a variable denoted as `q_T`. The chart illustrates a relationship between initial accuracy and the length of subsequent generation.
### Components/Axes
* **Chart Type:** Grouped Bar Chart.
* **Y-Axis:** Labeled "Number of tokens after first step (k)". The scale runs from 0 to 16 in increments of 2.
* **X-Axis:** Labeled "Pass@1 of `q_T`". It contains four categorical groups:
1. `(0, 33%]`
2. `(33%, 67%]`
3. `(67%, 100%)`
4. `Overall`
* **Legend:** Positioned in the top-right corner of the chart area.
* **Blue, diagonally hatched bar:** "First correct"
* **Solid orange bar:** "First incorrect"
### Detailed Analysis
The chart presents data for four categories on the x-axis. For each category, two bars are shown side-by-side.
**1. Category: (0, 33%]**
* **First correct (Blue hatched):** The bar reaches a value of **12.6**.
* **First incorrect (Orange solid):** The bar is taller, reaching a value of **14.5**.
* **Trend:** In this lowest accuracy bracket, both outcomes result in relatively high token counts, with incorrect attempts generating approximately 1.9k more tokens on average.
**2. Category: (33%, 67%]**
* **First correct (Blue hatched):** The bar height is **8.3**.
* **First incorrect (Orange solid):** The bar height is **11.4**.
* **Trend:** Both values decrease compared to the first category. The gap between correct and incorrect remains significant (~3.1k tokens).
**3. Category: (67%, 100%)**
* **First correct (Blue hatched):** The bar is the shortest in the chart, at **4.7**.
* **First incorrect (Orange solid):** The bar height is **7.4**.
* **Trend:** This highest accuracy bracket shows the lowest token counts for both outcomes. The difference between correct and incorrect is ~2.7k tokens.
**4. Category: Overall**
* **First correct (Blue hatched):** The bar height is **8.2**.
* **First incorrect (Orange solid):** The bar height is **11.3**.
* **Trend:** The overall averages reflect the pattern seen in the individual brackets: incorrect first attempts lead to longer subsequent generations (~3.1k more tokens).
### Key Observations
1. **Consistent Disparity:** In every single category, the "First incorrect" bar is taller than the "First correct" bar. This indicates that when the first step is incorrect, the model generates more tokens in the subsequent step.
2. **Inverse Relationship with Accuracy:** There is a clear inverse relationship between the Pass@1 accuracy of `q_T` and the number of tokens generated after the first step. As accuracy increases (moving right on the x-axis), the token count for *both* correct and incorrect first steps decreases.
3. **Narrowing Gap:** The absolute difference in token count between "First incorrect" and "First correct" appears to narrow slightly as accuracy increases (from ~1.9k to ~2.7k to ~2.7k, with the overall gap at ~3.1k). The relative difference, however, remains substantial.
4. **Overall Averages:** The "Overall" category provides a summary, showing that across all accuracy levels, a first incorrect step leads to an average of 11.3k tokens, while a first correct step leads to 8.2k tokens.
### Interpretation
The data suggests a strong correlation between the quality of an initial step (measured by Pass@1 accuracy) and the efficiency of the subsequent generation process. Two primary inferences can be drawn:
1. **Error Recovery Cost:** When the model's first step is incorrect, it appears to engage in a longer "recovery" or "correction" process, generating significantly more tokens. This could represent the model backtracking, exploring alternative paths, or producing more verbose justifications to arrive at a correct final answer.
2. **Confidence and Efficiency:** Higher initial accuracy (`q_T`) is associated with greater efficiency in the following step. This could mean that when the model is more confident or correct from the start, it requires less additional text to complete the task. The process becomes more direct and less verbose.
The chart does not provide causal information. It is unknown whether a longer subsequent generation *causes* a correct outcome or is merely *associated* with an incorrect first step. However, the consistent pattern across all accuracy brackets strongly implies that the length of the generation following the first step is a meaningful indicator of the initial step's correctness and the overall difficulty or uncertainty of the problem for the model.