## Bar Chart: Number of Tokens After First Step by Pass@1 of q_T
### Overview
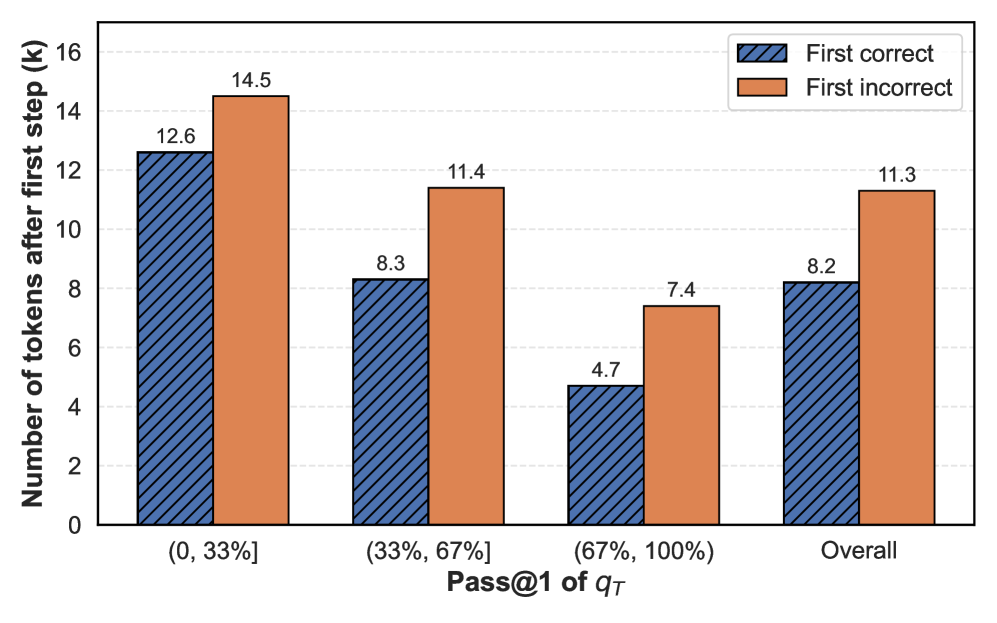
The chart compares the number of tokens after the first step for two categories: "First correct" (blue, striped) and "First incorrect" (orange, solid). Data is grouped by four Pass@1 of q_T ranges: (0, 33%], (33%, 67%], (67%, 100%], and Overall. The y-axis represents the number of tokens (k), ranging from 0 to 16.
### Components/Axes
- **X-axis**: Pass@1 of q_T categories:
- (0, 33%]
- (33%, 67%]
- (67%, 100%]
- Overall
- **Y-axis**: Number of tokens after first step (k), scaled from 0 to 16.
- **Legend**:
- Blue (striped): First correct
- Orange (solid): First incorrect
- **Placement**: Legend is in the top-right corner. Bars are grouped by category, with "First correct" on the left and "First incorrect" on the right for each group.
### Detailed Analysis
- **(0, 33%]**
- First correct: 12.6 tokens (blue)
- First incorrect: 14.5 tokens (orange)
- **(33%, 67%]**
- First correct: 8.3 tokens (blue)
- First incorrect: 11.4 tokens (orange)
- **(67%, 100%]**
- First correct: 4.7 tokens (blue)
- First incorrect: 7.4 tokens (orange)
- **Overall**
- First correct: 8.2 tokens (blue)
- First incorrect: 11.3 tokens (orange)
### Key Observations
1. **Consistent Disparity**: "First incorrect" tokens consistently outnumber "First correct" tokens across all categories.
2. **Largest Gap in Lowest Range**: The (0, 33%] category shows the highest difference (14.5 vs. 12.6 tokens).
3. **Decreasing Correct Tokens**: "First correct" tokens decrease as Pass@1 increases (12.6 → 8.3 → 4.7).
4. **Overall Trend**: The "First incorrect" average (11.3) is 37.5% higher than "First correct" (8.2).
### Interpretation
The data suggests that lower confidence ranges (Pass@1 ≤ 33%) are associated with higher error rates in the first step, as reflected by the larger gap between correct and incorrect tokens. While the gap narrows in higher confidence ranges (67–100%), incorrect tokens still dominate. The "Overall" category indicates a systemic bias toward incorrect tokens, even when averaged across all ranges. This could imply challenges in the model's initial processing steps, particularly in low-confidence scenarios, warranting further investigation into error sources or confidence calibration.