## Line Graphs: Prisoner's Dilemma Metrics Over Timesteps
### Overview
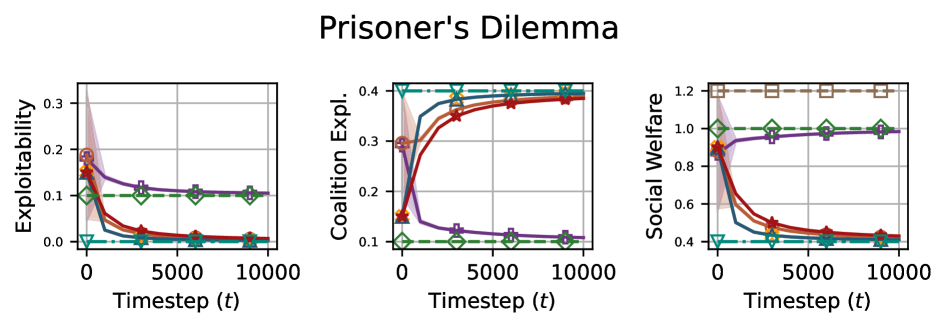
The image contains three line graphs titled "Prisoner's Dilemma," each tracking a distinct metric (Exploitability, Coalition Exploitability, Social Welfare) across timesteps (t = 0 to 10,000). The graphs use color-coded lines with distinct markers to represent different strategies/models. All graphs share the same x-axis (timesteps) but have unique y-axes and legends.
---
### Components/Axes
#### Common Elements:
- **X-axis**: Labeled "Timestep (t)" with values at 0, 5,000, and 10,000.
- **Legends**: Positioned on the right side of each graph, with colors and markers mapped to strategies/models.
#### Graph-Specific Axes:
1. **Left Graph (Exploitability)**:
- **Y-axis**: Labeled "Exploitability" with values from 0.0 to 0.3.
- **Legend Entries**:
- Purple circle: "Tit-for-Tat"
- Green diamond: "Always Cooperate"
- Red star: "Always Defect"
- Blue triangle: "Random"
- Orange square: "Grim Trigger"
- Cyan cross: "Pavlov"
2. **Middle Graph (Coalition Exploitability)**:
- **Y-axis**: Labeled "Coalition Exploit. Expl." with values from 0.0 to 0.4.
- **Legend Entries**:
- Purple circle: "Tit-for-Tat"
- Green diamond: "Always Cooperate"
- Red star: "Always Defect"
- Blue triangle: "Random"
- Orange square: "Grim Trigger"
- Cyan cross: "Pavlov"
3. **Right Graph (Social Welfare)**:
- **Y-axis**: Labeled "Social Welfare" with values from 0.0 to 1.2.
- **Legend Entries**:
- Purple circle: "Tit-for-Tat"
- Green diamond: "Always Cooperate"
- Red star: "Always Defect"
- Blue triangle: "Random"
- Orange square: "Grim Trigger"
- Cyan cross: "Pavlov"
- **Additional Element**: A brown dashed horizontal line labeled "Max Social Welfare" at y = 1.2.
---
### Detailed Analysis
#### Left Graph (Exploitability):
- **Trends**:
- **Always Cooperate (Green)**: Starts at ~0.12, drops sharply to ~0.02 by t=5,000, and stabilizes.
- **Tit-for-Tat (Purple)**: Begins at ~0.18, declines gradually to ~0.08 by t=10,000.
- **Always Defect (Red)**: Starts at ~0.15, drops to ~0.03 by t=5,000, then plateaus.
- **Random (Blue)**: Declines from ~0.1 to ~0.01 by t=10,000.
- **Grim Trigger (Orange)**: Drops from ~0.14 to ~0.04 by t=5,000, then stabilizes.
- **Pavlov (Cyan)**: Declines from ~0.13 to ~0.02 by t=10,000.
#### Middle Graph (Coalition Exploitability):
- **Trends**:
- **Always Cooperate (Green)**: Starts at ~0.35, drops to ~0.08 by t=5,000, then stabilizes.
- **Tit-for-Tat (Purple)**: Declines from ~0.28 to ~0.09 by t=10,000.
- **Always Defect (Red)**: Rises from ~0.15 to ~0.38 by t=10,000.
- **Random (Blue)**: Stays near ~0.05 throughout.
- **Grim Trigger (Orange)**: Increases from ~0.25 to ~0.38 by t=10,000.
- **Pavlov (Cyan)**: Rises from ~0.22 to ~0.39 by t=10,000.
#### Right Graph (Social Welfare):
- **Trends**:
- **Always Cooperate (Green)**: Starts at ~1.0, drops to ~0.95 by t=5,000, then stabilizes.
- **Tit-for-Tat (Purple)**: Declines from ~0.9 to ~0.8 by t=10,000.
- **Always Defect (Red)**: Rises from ~0.4 to ~0.6 by t=10,000.
- **Random (Blue)**: Stays near ~0.4 throughout.
- **Grim Trigger (Orange)**: Increases from ~0.5 to ~1.1 by t=10,000.
- **Pavlov (Cyan)**: Rises from ~0.5 to ~1.1 by t=10,000.
- **Max Social Welfare (Brown Dashed Line)**: Constant at y=1.2.
---
### Key Observations
1. **Exploitability**:
- "Always Cooperate" and "Tit-for-Tat" strategies show the steepest declines, suggesting reduced vulnerability to exploitation over time.
- "Always Defect" and "Random" strategies exhibit lower exploitability early but stabilize at higher values.
2. **Coalition Exploitability**:
- "Grim Trigger" and "Pavlov" strategies show significant increases, indicating higher susceptibility to coalition-based exploitation.
- "Always Defect" also rises sharply, while "Random" remains stable.
3. **Social Welfare**:
- "Grim Trigger" and "Pavlov" strategies approach the "Max Social Welfare" threshold (~1.2), suggesting optimal collective outcomes.
- "Always Cooperate" maintains high welfare but declines slightly, while "Always Defect" and "Random" perform poorly.
---
### Interpretation
The data demonstrates trade-offs between individual and collective outcomes in the Prisoner's Dilemma:
- **Strategies like "Grim Trigger" and "Pavlov"** maximize social welfare but increase coalition exploitability, suggesting they foster cooperation at the cost of vulnerability to group exploitation.
- **"Tit-for-Tat" and "Always Cooperate"** reduce individual exploitability but lag in social welfare, indicating a focus on self-preservation over collective gain.
- **"Always Defect"** and **"Random"** strategies perform poorly across metrics, highlighting their unsustainability in cooperative environments.
The "Max Social Welfare" line (1.2) serves as a benchmark, showing that only "Grim Trigger" and "Pavlov" approach this ideal, albeit with higher coalition risks. This aligns with game theory principles where tit-for-tat balances cooperation and retaliation, while grim trigger and Pavlov prioritize long-term cooperation despite short-term risks.