## Bar Chart: Reflection Frequency Before and After GRPO
### Overview
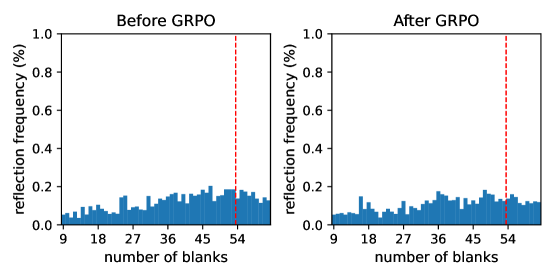
The image presents two bar charts side-by-side, comparing the reflection frequency (%) against the number of blanks before and after a process called GRPO. Both charts display the same x and y axis scales, with a vertical dashed red line at x=54. The charts show the distribution of reflection frequencies across different numbers of blanks.
### Components/Axes
* **Titles:**
* Left Chart: "Before GRPO"
* Right Chart: "After GRPO"
* **Y-axis (both charts):**
* Label: "reflection frequency (%)"
* Scale: 0.0 to 1.0, with increments of 0.2 (0.0, 0.2, 0.4, 0.6, 0.8, 1.0)
* **X-axis (both charts):**
* Label: "number of blanks"
* Scale: 9 to 54, with increments of 9 (9, 18, 27, 36, 45, 54)
* **Vertical Line:** Dashed red line at x=54 in both charts.
### Detailed Analysis
**Left Chart: Before GRPO**
* The bars are blue.
* The reflection frequency generally fluctuates between 0.0 and 0.2.
* The bars are generally between 0.0 and 0.1 for number of blanks between 9 and 27.
* The bars are generally between 0.1 and 0.2 for number of blanks between 27 and 54.
**Right Chart: After GRPO**
* The bars are blue.
* The reflection frequency generally fluctuates between 0.0 and 0.2.
* The bars are generally between 0.0 and 0.1 for number of blanks between 9 and 27.
* The bars are generally between 0.1 and 0.2 for number of blanks between 27 and 54.
### Key Observations
* Both charts show a similar distribution of reflection frequencies.
* The reflection frequencies are generally low, mostly below 0.2.
* The dashed red line at x=54 might indicate a threshold or a specific point of interest.
* There is no significant visual difference between the "Before GRPO" and "After GRPO" charts.
### Interpretation
The charts compare the reflection frequency distribution before and after the GRPO process. The data suggests that the GRPO process does not significantly alter the reflection frequency distribution across the number of blanks. The reflection frequencies remain generally low in both cases. The vertical line at x=54 could represent a critical number of blanks, but without further context, its significance is unclear. The similarity between the two charts implies that GRPO, as applied here, has little to no impact on the reflection frequency distribution.