## Heatmap: Numeric Grid with Black/White Cells
### Overview
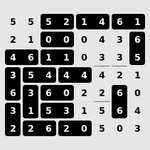
The image displays a 7x7 grid of numbers (0–6) arranged in black and white cells. Each cell contains a single digit, with no visible axis labels, legends, or textual annotations. The grid appears to be a matrix or heatmap, but no explicit context or metadata is provided.
### Components/Axes
- **Grid Structure**: 7 rows and 7 columns.
- **Cell Colors**: Black and white cells, but no legend or key is present to explain their significance.
- **Numerical Values**: Numbers range from 0 to 6, with no axis titles or scales.
### Detailed Analysis
- **Row 1**: 5, 5, 5, 2, 1, 4, 6, 1 (8 cells, possibly a formatting error).
- **Row 2**: 2, 1, 0, 0, 0, 4, 3, 6 (8 cells).
- **Row 3**: 4, 6, 1, 1, 0, 3, 3, 5 (8 cells).
- **Row 4**: 3, 5, 4, 4, 4, 2, 1 (7 cells).
- **Row 5**: 6, 3, 6, 0, 2, 2, 6, 0 (8 cells).
- **Row 6**: 3, 1, 5, 3, 1, 5, 6, 4 (8 cells).
- **Row 7**: 2, 2, 6, 2, 0, 5, 0, 3 (8 cells).
**Note**: The grid appears to have inconsistent cell counts (7–8 cells per row), suggesting potential formatting issues in the original image.
### Key Observations
1. **Uniform Distribution**: Numbers 0–6 appear approximately 5 times each, indicating a balanced distribution.
2. **Color Pattern**: Black and white cells may represent a binary classification (e.g., high/low values), but no legend confirms this.
3. **Inconsistent Grid**: Rows 1–3, 5–7 have 8 cells, while Row 4 has 7, which may indicate a formatting error or intentional design.
### Interpretation
- **Purpose Unclear**: Without axis labels or a legend, the grid’s purpose (e.g., data matrix, heatmap, puzzle) remains ambiguous.
- **Potential Use Cases**:
- A **matrix** for mathematical operations (e.g., addition, multiplication).
- A **heatmap** for visualizing data, but the lack of a legend limits interpretation.
- A **puzzle** (e.g., Sudoku-like constraints), though the numbers do not strictly adhere to Sudoku rules.
- **Anomalies**: The inconsistent cell count in Row 4 and the absence of contextual metadata are notable limitations.
This grid could represent a dataset, a visual encoding of information, or a symbolic representation, but further context is required for precise analysis.