## Heatmap: Classification Accuracies
### Overview
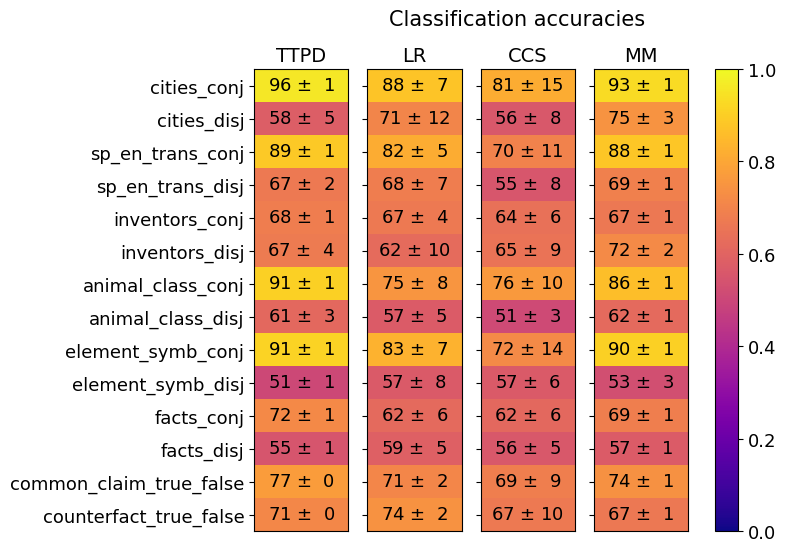
The image is a heatmap displaying classification accuracies for different models (TTPD, LR, CCS, MM) across various categories (cities_conj, cities_disj, etc.). The heatmap uses a color gradient from dark blue (0.0) to bright yellow (1.0) to represent the accuracy values. Each cell contains the accuracy value with its uncertainty (± value).
### Components/Axes
* **Title:** Classification accuracies
* **Columns (Models):** TTPD, LR, CCS, MM
* **Rows (Categories):**
* cities\_conj
* cities\_disj
* sp\_en\_trans\_conj
* sp\_en\_trans\_disj
* inventors\_conj
* inventors\_disj
* animal\_class\_conj
* animal\_class\_disj
* element\_symb\_conj
* element\_symb\_disj
* facts\_conj
* facts\_disj
* common\_claim\_true\_false
* counterfact\_true\_false
* **Colorbar (Accuracy):** Ranges from 0.0 (dark blue) to 1.0 (bright yellow), with intermediate values indicated.
### Detailed Analysis
The heatmap presents classification accuracies for each model and category combination. The values are displayed with their associated uncertainty.
Here's a breakdown of the data:
* **TTPD:**
* cities\_conj: 96 ± 1
* cities\_disj: 58 ± 5
* sp\_en\_trans\_conj: 89 ± 1
* sp\_en\_trans\_disj: 67 ± 2
* inventors\_conj: 68 ± 1
* inventors\_disj: 67 ± 4
* animal\_class\_conj: 91 ± 1
* animal\_class\_disj: 61 ± 3
* element\_symb\_conj: 91 ± 1
* element\_symb\_disj: 51 ± 1
* facts\_conj: 72 ± 1
* facts\_disj: 55 ± 1
* common\_claim\_true\_false: 77 ± 0
* counterfact\_true\_false: 71 ± 0
* **LR:**
* cities\_conj: 88 ± 7
* cities\_disj: 71 ± 12
* sp\_en\_trans\_conj: 82 ± 5
* sp\_en\_trans\_disj: 68 ± 7
* inventors\_conj: 67 ± 4
* inventors\_disj: 62 ± 10
* animal\_class\_conj: 75 ± 8
* animal\_class\_disj: 57 ± 5
* element\_symb\_conj: 83 ± 7
* element\_symb\_disj: 57 ± 8
* facts\_conj: 62 ± 6
* facts\_disj: 59 ± 5
* common\_claim\_true\_false: 71 ± 2
* counterfact\_true\_false: 74 ± 2
* **CCS:**
* cities\_conj: 81 ± 15
* cities\_disj: 56 ± 8
* sp\_en\_trans\_conj: 70 ± 11
* sp\_en\_trans\_disj: 55 ± 8
* inventors\_conj: 64 ± 6
* inventors\_disj: 65 ± 9
* animal\_class\_conj: 76 ± 10
* animal\_class\_disj: 51 ± 3
* element\_symb\_conj: 72 ± 14
* element\_symb\_disj: 57 ± 6
* facts\_conj: 62 ± 6
* facts\_disj: 56 ± 5
* common\_claim\_true\_false: 69 ± 9
* counterfact\_true\_false: 67 ± 10
* **MM:**
* cities\_conj: 93 ± 1
* cities\_disj: 75 ± 3
* sp\_en\_trans\_conj: 88 ± 1
* sp\_en\_trans\_disj: 69 ± 1
* inventors\_conj: 67 ± 1
* inventors\_disj: 72 ± 2
* animal\_class\_conj: 86 ± 1
* animal\_class\_disj: 62 ± 1
* element\_symb\_conj: 90 ± 1
* element\_symb\_disj: 53 ± 3
* facts\_conj: 69 ± 1
* facts\_disj: 57 ± 1
* common\_claim\_true\_false: 74 ± 1
* counterfact\_true\_false: 67 ± 1
### Key Observations
* TTPD generally has higher accuracy for "conj" categories (cities\_conj, sp\_en\_trans\_conj, animal\_class\_conj, element\_symb\_conj) compared to other models.
* All models struggle with "disj" categories, particularly "element\_symb\_disj" and "animal\_class\_disj".
* CCS has the highest uncertainty in many categories.
* TTPD has 0 uncertainty for common\_claim\_true\_false and counterfact\_true\_false.
### Interpretation
The heatmap provides a visual comparison of the classification accuracies of four different models across a range of categories. The data suggests that the TTPD model performs particularly well on conjunctive categories, while all models struggle with disjunctive categories. The higher uncertainty values for CCS indicate that its performance is less consistent across different runs or datasets. The heatmap allows for easy identification of strengths and weaknesses of each model, which can inform model selection and further development.