## Heatmap: Classification Accuracies
### Overview
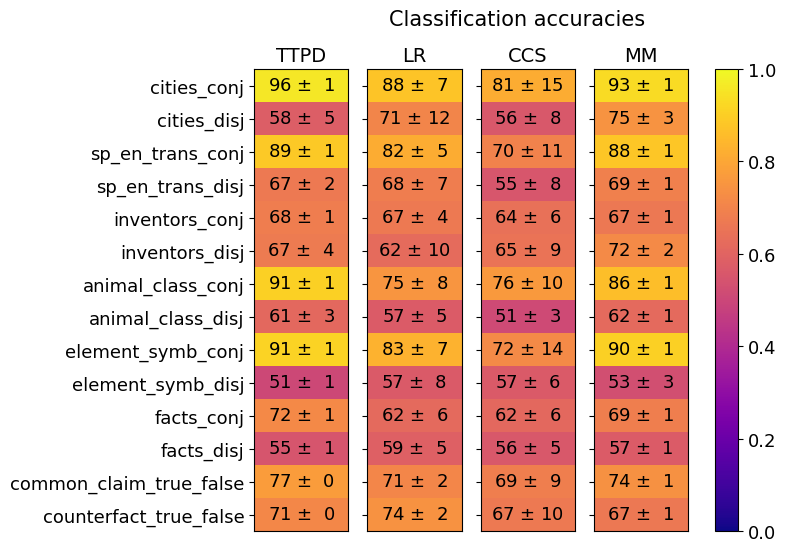
This image presents a heatmap visualizing classification accuracies for several datasets and methods. The heatmap displays the performance of four different classification methods (TTPD, LR, CCS, MM) across ten different datasets, each represented in both conjunctive ('conj') and disjunctive ('disj') forms. A color scale on the right indicates the accuracy level, ranging from 0.0 to 1.0. Each cell in the heatmap shows the accuracy value with a standard deviation.
### Components/Axes
* **Y-axis (Rows):** Represents the datasets. The datasets are:
* cities\_conj
* cities\_disj
* sp\_en\_trans\_conj
* sp\_en\_trans\_disj
* inventors\_conj
* inventors\_disj
* animal\_class\_conj
* animal\_class\_disj
* element\_symb\_conj
* element\_symb\_disj
* facts\_conj
* facts\_disj
* common\_claim\_true\_false
* counterfact\_true\_false
* **X-axis (Columns):** Represents the classification methods:
* TTPD (Green)
* LR (Yellow)
* CCS (Blue)
* MM (Purple)
* **Color Scale:** Represents the classification accuracy, ranging from 0.0 (red) to 1.0 (green).
* **Cell Values:** Each cell displays the accuracy as "value ± standard deviation".
### Detailed Analysis
Here's a breakdown of the accuracy values, method by method, and dataset by dataset. I will describe the trend first, then provide the values.
**TTPD (Green):** Generally high accuracy, with a slight downward trend towards the bottom of the heatmap.
* cities\_conj: 96 ± 1
* cities\_disj: 58 ± 5
* sp\_en\_trans\_conj: 89 ± 1
* sp\_en\_trans\_disj: 67 ± 2
* inventors\_conj: 68 ± 1
* inventors\_disj: 67 ± 4
* animal\_class\_conj: 91 ± 1
* animal\_class\_disj: 61 ± 3
* element\_symb\_conj: 91 ± 1
* element\_symb\_disj: 51 ± 1
* facts\_conj: 72 ± 1
* facts\_disj: 55 ± 1
* common\_claim\_true\_false: 77 ± 0
* counterfact\_true\_false: 71 ± 0
**LR (Yellow):** Shows more variability than TTPD.
* cities\_conj: 88 ± 7
* cities\_disj: 71 ± 12
* sp\_en\_trans\_conj: 82 ± 5
* sp\_en\_trans\_disj: 68 ± 7
* inventors\_conj: 67 ± 4
* inventors\_disj: 62 ± 10
* animal\_class\_conj: 75 ± 8
* animal\_class\_disj: 57 ± 5
* element\_symb\_conj: 83 ± 7
* element\_symb\_disj: 57 ± 8
* facts\_conj: 62 ± 6
* facts\_disj: 59 ± 5
* common\_claim\_true\_false: 71 ± 2
* counterfact\_true\_false: 74 ± 2
**CCS (Blue):** Generally lower accuracy compared to TTPD and LR, with a relatively flat trend.
* cities\_conj: 81 ± 15
* cities\_disj: 56 ± 8
* sp\_en\_trans\_conj: 70 ± 11
* sp\_en\_trans\_disj: 55 ± 8
* inventors\_conj: 64 ± 6
* inventors\_disj: 65 ± 9
* animal\_class\_conj: 76 ± 10
* animal\_class\_disj: 51 ± 3
* element\_symb\_conj: 72 ± 14
* element\_symb\_disj: 57 ± 6
* facts\_conj: 62 ± 6
* facts\_disj: 56 ± 5
* common\_claim\_true\_false: 69 ± 9
* counterfact\_true\_false: 67 ± 10
**MM (Purple):** Similar to LR in variability, but generally slightly lower accuracy.
* cities\_conj: 93 ± 1
* cities\_disj: 75 ± 3
* sp\_en\_trans\_conj: 88 ± 1
* sp\_en\_trans\_disj: 69 ± 1
* inventors\_conj: 67 ± 1
* inventors\_disj: 72 ± 2
* animal\_class\_conj: 86 ± 1
* animal\_class\_disj: 62 ± 1
* element\_symb\_conj: 90 ± 1
* element\_symb\_disj: 53 ± 3
* facts\_conj: 69 ± 1
* facts\_disj: 57 ± 1
* common\_claim\_true\_false: 74 ± 1
* counterfact\_true\_false: 67 ± 1
### Key Observations
* TTPD consistently achieves the highest accuracy for the 'conj' datasets (cities, sp\_en\_trans, animal\_class, element\_symb, common\_claim\_true\_false).
* The 'disj' datasets generally have lower accuracy scores across all methods.
* CCS consistently performs the worst across most datasets.
* The standard deviations are relatively small for TTPD, suggesting more stable performance.
* The highest accuracy achieved is 96 ± 1 (TTPD on cities\_conj).
* The lowest accuracy achieved is 51 ± 3 (CCS on animal\_class\_disj).
### Interpretation
The heatmap demonstrates the performance of different classification methods on various datasets, distinguishing between conjunctive and disjunctive forms. The consistently high performance of TTPD on conjunctive datasets suggests it is well-suited for tasks where features are combined. The lower accuracy on disjunctive datasets indicates a potential challenge in handling scenarios where features are alternatives. The poor performance of CCS across the board suggests it may not be an effective method for these types of classification tasks. The difference in performance between conjunctive and disjunctive forms highlights the importance of considering the logical structure of the data when selecting a classification method. The small standard deviations for TTPD suggest that its performance is robust and less sensitive to variations in the data. The heatmap provides a clear visual comparison of the strengths and weaknesses of each method, enabling informed decisions about which method to use for a given dataset and task.