TECHNICAL ASSET FINGERPRINT
53407f3fae01af77b734a488
Click to view fullscreen
Press ESC or click to close
FOUND IN PAPERS
EXPERT: healer-alpha-free VERSION 1
RUNTIME: free/openrouter/healer-alpha
INTEL_VERIFIED
\n
## Heatmap: Classification Accuracies
### Overview
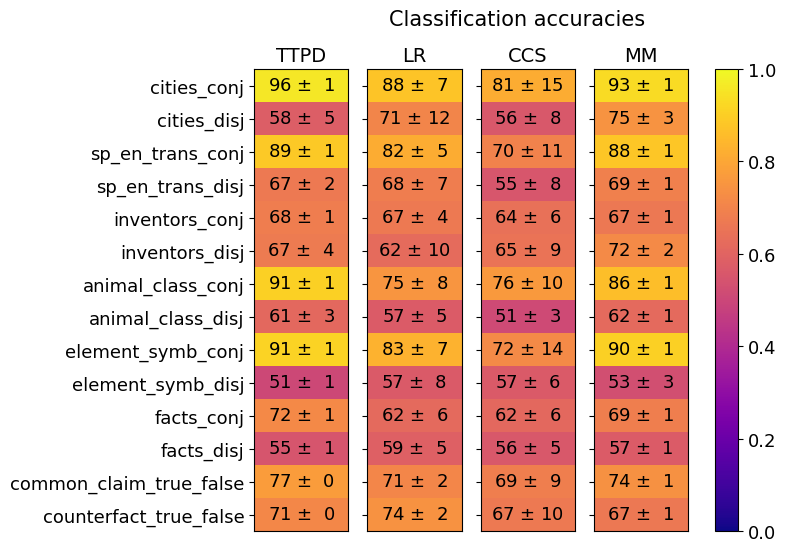
The image is a heatmap titled "Classification accuracies" that displays the performance (accuracy) of four different models or methods across fourteen distinct classification tasks. The performance is quantified as a mean accuracy value with an associated standard deviation (e.g., "96 ± 1"). The accuracy is also represented by a color gradient, with a color bar on the right serving as a legend.
### Components/Axes
* **Title:** "Classification accuracies" (centered at the top).
* **Rows (Tasks):** 14 tasks are listed vertically on the left side. From top to bottom:
1. `cities_conj`
2. `cities_disj`
3. `sp_en_trans_conj`
4. `sp_en_trans_disj`
5. `inventors_conj`
6. `inventors_disj`
7. `animal_class_conj`
8. `animal_class_disj`
9. `element_symb_conj`
10. `element_symb_disj`
11. `facts_conj`
12. `facts_disj`
13. `common_claim_true_false`
14. `counterfact_true_false`
* **Columns (Models/Methods):** 4 models are listed horizontally at the top. From left to right:
1. `TTPD`
2. `LR`
3. `CCS`
4. `MM`
* **Color Bar/Legend:** Positioned on the right side of the heatmap. It is a vertical gradient bar labeled from `0.0` (bottom, dark purple) to `1.0` (top, bright yellow). The gradient transitions from purple (low accuracy) through red/orange to yellow (high accuracy).
* **Data Cells:** Each cell in the 14x4 grid contains a text label showing the mean accuracy ± standard deviation. The cell's background color corresponds to the mean accuracy value according to the color bar.
### Detailed Analysis
The following table reconstructs the data presented in the heatmap. Values are `Mean Accuracy ± Standard Deviation`.
| Task | TTPD | LR | CCS | MM |
| :--- | :--- | :--- | :--- | :--- |
| **cities_conj** | 96 ± 1 | 88 ± 7 | 81 ± 15 | 93 ± 1 |
| **cities_disj** | 58 ± 5 | 71 ± 12 | 56 ± 8 | 75 ± 3 |
| **sp_en_trans_conj** | 89 ± 1 | 82 ± 5 | 70 ± 11 | 88 ± 1 |
| **sp_en_trans_disj** | 67 ± 2 | 68 ± 7 | 55 ± 8 | 69 ± 1 |
| **inventors_conj** | 68 ± 1 | 67 ± 4 | 64 ± 6 | 67 ± 1 |
| **inventors_disj** | 67 ± 4 | 62 ± 10 | 65 ± 9 | 72 ± 2 |
| **animal_class_conj** | 91 ± 1 | 75 ± 8 | 76 ± 10 | 86 ± 1 |
| **animal_class_disj** | 61 ± 3 | 57 ± 5 | 51 ± 3 | 62 ± 1 |
| **element_symb_conj** | 91 ± 1 | 83 ± 7 | 72 ± 14 | 90 ± 1 |
| **element_symb_disj** | 51 ± 1 | 57 ± 8 | 57 ± 6 | 53 ± 3 |
| **facts_conj** | 72 ± 1 | 62 ± 6 | 62 ± 6 | 69 ± 1 |
| **facts_disj** | 55 ± 1 | 59 ± 5 | 56 ± 5 | 57 ± 1 |
| **common_claim_true_false** | 77 ± 0 | 71 ± 2 | 69 ± 9 | 74 ± 1 |
| **counterfact_true_false** | 71 ± 0 | 74 ± 2 | 67 ± 10 | 67 ± 1 |
**Trend Verification by Model:**
* **TTPD (Column 1):** Shows a pattern of very high accuracy (bright yellow cells, >90) on conjunctive (`_conj`) tasks like `cities_conj`, `animal_class_conj`, and `element_symb_conj`. Its performance drops significantly (orange/red cells, 50s-60s) on corresponding disjunctive (`_disj`) tasks. It has the highest accuracy on 7 of the 14 tasks.
* **LR (Column 2):** Performance is more moderate and variable. It does not achieve the highest accuracy on any single task. Its highest scores are on `cities_conj` (88) and `element_symb_conj` (83).
* **CCS (Column 3):** Generally shows the lowest performance across most tasks, indicated by more red/purple cells. It has the highest standard deviations (e.g., ±15 on `cities_conj`), suggesting less consistent results. Its highest accuracy is 81 on `cities_conj`.
* **MM (Column 4):** Performs strongly, often close to or matching TTPD. It achieves the highest accuracy on `cities_disj` (75) and `inventors_disj` (72). Its performance is notably stable, with very low standard deviations (often ±1).
### Key Observations
1. **Conjunctive vs. Disjunctive Tasks:** There is a clear and consistent performance gap. All models achieve substantially higher accuracy on tasks with the `_conj` suffix compared to their `_disj` counterparts. For example, TTPD scores 96 on `cities_conj` vs. 58 on `cities_disj`.
2. **Model Performance Hierarchy:** TTPD and MM are the top-performing models, with TTPD leading on conjunctive tasks and MM showing strong, stable performance overall. LR is mid-tier, and CCS is consistently the lowest-performing model.
3. **Task Difficulty:** The `element_symb_disj` task appears to be the most challenging, with all models scoring in the low-to-mid 50s. The `cities_conj` task is the easiest, with three models scoring above 80.
4. **Stability (Standard Deviation):** TTPD and MM exhibit very low standard deviations (often ±0 or ±1), indicating highly consistent performance across runs. CCS shows the highest variance, particularly on `cities_conj` (±15) and `element_symb_conj` (±14).
### Interpretation
This heatmap provides a comparative analysis of reasoning or classification capabilities across different logical constructs (conjunction vs. disjunction) and knowledge domains (cities, translations, inventors, etc.).
* **The `_conj`/`_disj` Divide:** The most significant finding is the systematic performance drop on disjunctive tasks. This suggests that the models, particularly TTPD, find reasoning with logical "OR" (disjunction) fundamentally more difficult than reasoning with logical "AND" (conjunction). This could be due to the nature of the training data, the model architectures, or the inherent complexity of verifying disjunctive statements.
* **Model Specialization:** TTPD appears to be a specialist, excelling brilliantly on a specific class of problems (conjunctive reasoning) but faltering on others. MM presents as a more robust and general-purpose model, with high and stable performance across the board. The poor and inconsistent performance of CCS might indicate it is a baseline or less sophisticated method.
* **Task-Specific Insights:** The high accuracy on `cities_conj` suggests geographic knowledge is well-captured. The difficulty of `element_symb_disj` might relate to the complexity of chemical knowledge or the specific formulation of the disjunctive queries about elements.
* **Practical Implication:** For applications requiring reliable performance across varied logical tasks, MM would be the most dependable choice based on this data. If the application domain is known to involve primarily conjunctive reasoning, TTPD could be optimal. The data warns against using CCS for tasks requiring high accuracy or consistency.
DECODING INTELLIGENCE...