## Heatmap: Classification accuracies
### Overview
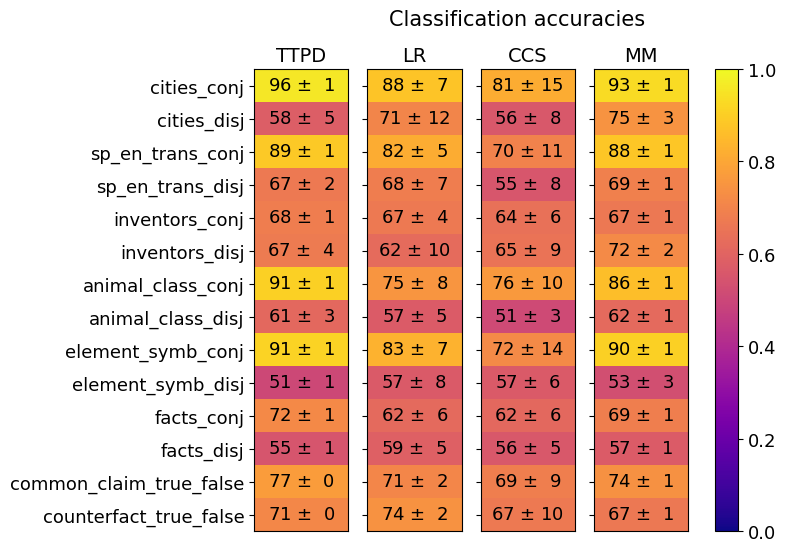
The image is a heatmap visualizing classification accuracies across 12 linguistic categories and 4 methods (TTPD, LR, CCS, MM). Values are represented as percentages with standard deviations (±), using a color gradient from purple (low accuracy) to yellow (high accuracy). The legend on the right maps colors to accuracy ranges (0.0–1.0).
### Components/Axes
- **Y-axis (Categories)**:
- cities_conj, cities_disj
- sp_en_trans_conj, sp_en_trans_disj
- inventors_conj, inventors_disj
- animal_class_conj, animal_class_disj
- element_symb_conj, element_symb_disj
- facts_conj, facts_disj
- common_claim_true_false, counterfact_true_false
- **X-axis (Methods)**: TTPD, LR, CCS, MM
- **Legend**: Color gradient from purple (0.0) to yellow (1.0), labeled "Classification accuracies."
### Detailed Analysis
#### Categories and Method Values
1. **cities_conj**:
- TTPD: 96 ± 1 (yellow)
- LR: 88 ± 7 (orange)
- CCS: 81 ± 15 (orange)
- MM: 93 ± 1 (yellow)
2. **cities_disj**:
- TTPD: 58 ± 5 (orange)
- LR: 71 ± 12 (orange)
- CCS: 56 ± 8 (orange)
- MM: 75 ± 3 (orange)
3. **sp_en_trans_conj**:
- TTPD: 89 ± 1 (yellow)
- LR: 82 ± 5 (orange)
- CCS: 70 ± 11 (orange)
- MM: 88 ± 1 (yellow)
4. **sp_en_trans_disj**:
- TTPD: 67 ± 2 (orange)
- LR: 68 ± 7 (orange)
- CCS: 55 ± 8 (orange)
- MM: 69 ± 1 (orange)
5. **inventors_conj**:
- TTPD: 68 ± 1 (orange)
- LR: 67 ± 4 (orange)
- CCS: 64 ± 6 (orange)
- MM: 67 ± 1 (orange)
6. **inventors_disj**:
- TTPD: 67 ± 4 (orange)
- LR: 62 ± 10 (orange)
- CCS: 65 ± 9 (orange)
- MM: 72 ± 2 (orange)
7. **animal_class_conj**:
- TTPD: 91 ± 1 (yellow)
- LR: 75 ± 8 (orange)
- CCS: 76 ± 10 (orange)
- MM: 86 ± 1 (yellow)
8. **animal_class_disj**:
- TTPD: 61 ± 3 (orange)
- LR: 57 ± 5 (orange)
- CCS: 51 ± 3 (orange)
- MM: 62 ± 1 (orange)
9. **element_symb_conj**:
- TTPD: 91 ± 1 (yellow)
- LR: 83 ± 7 (orange)
- CCS: 72 ± 14 (orange)
- MM: 90 ± 1 (yellow)
10. **element_symb_disj**:
- TTPD: 51 ± 1 (orange)
- LR: 57 ± 8 (orange)
- CCS: 57 ± 6 (orange)
- MM: 53 ± 3 (orange)
11. **facts_conj**:
- TTPD: 72 ± 1 (orange)
- LR: 62 ± 6 (orange)
- CCS: 62 ± 6 (orange)
- MM: 69 ± 1 (orange)
12. **facts_disj**:
- TTPD: 55 ± 1 (orange)
- LR: 59 ± 5 (orange)
- CCS: 56 ± 5 (orange)
- MM: 57 ± 1 (orange)
13. **common_claim_true_false**:
- TTPD: 77 ± 0 (orange)
- LR: 71 ± 2 (orange)
- CCS: 69 ± 9 (orange)
- MM: 74 ± 1 (orange)
14. **counterfact_true_false**:
- TTPD: 71 ± 0 (orange)
- LR: 74 ± 2 (orange)
- CCS: 67 ± 10 (orange)
- MM: 67 ± 1 (orange)
### Key Observations
- **Highest accuracies**: TTPD and MM dominate conjunction categories (e.g., cities_conj: 96 ±1, element_symb_conj: 91 ±1).
- **Lowest accuracies**: Disjunction categories (e.g., cities_disj: 58 ±5, element_symb_disj: 51 ±1) across all methods.
- **Method variability**: CCS shows the highest standard deviations (e.g., sp_en_trans_disj: ±8, element_symb_conj: ±14), indicating less consistency.
- **Color alignment**: Yellow dominates conjunction categories, while orange/purple prevails in disjunction categories.
### Interpretation
The data suggests that **TTPD and MM** outperform LR and CCS in conjunction tasks, likely due to their ability to handle structured relationships. Disjunction tasks (e.g., "cities_disj," "element_symb_disj") are consistently challenging, with accuracies dropping by 20–30% compared to conjunctions. CCS exhibits the greatest variability, possibly due to sensitivity to input noise or model architecture limitations. The near-perfect standard deviations in TTPD (e.g., ±0 for common_claim_true_false) highlight its robustness in specific categories. This heatmap underscores the importance of method selection based on task type (conjunction vs. disjunction) and data structure.