## Line Charts: Qwen Model Performance Comparison
### Overview
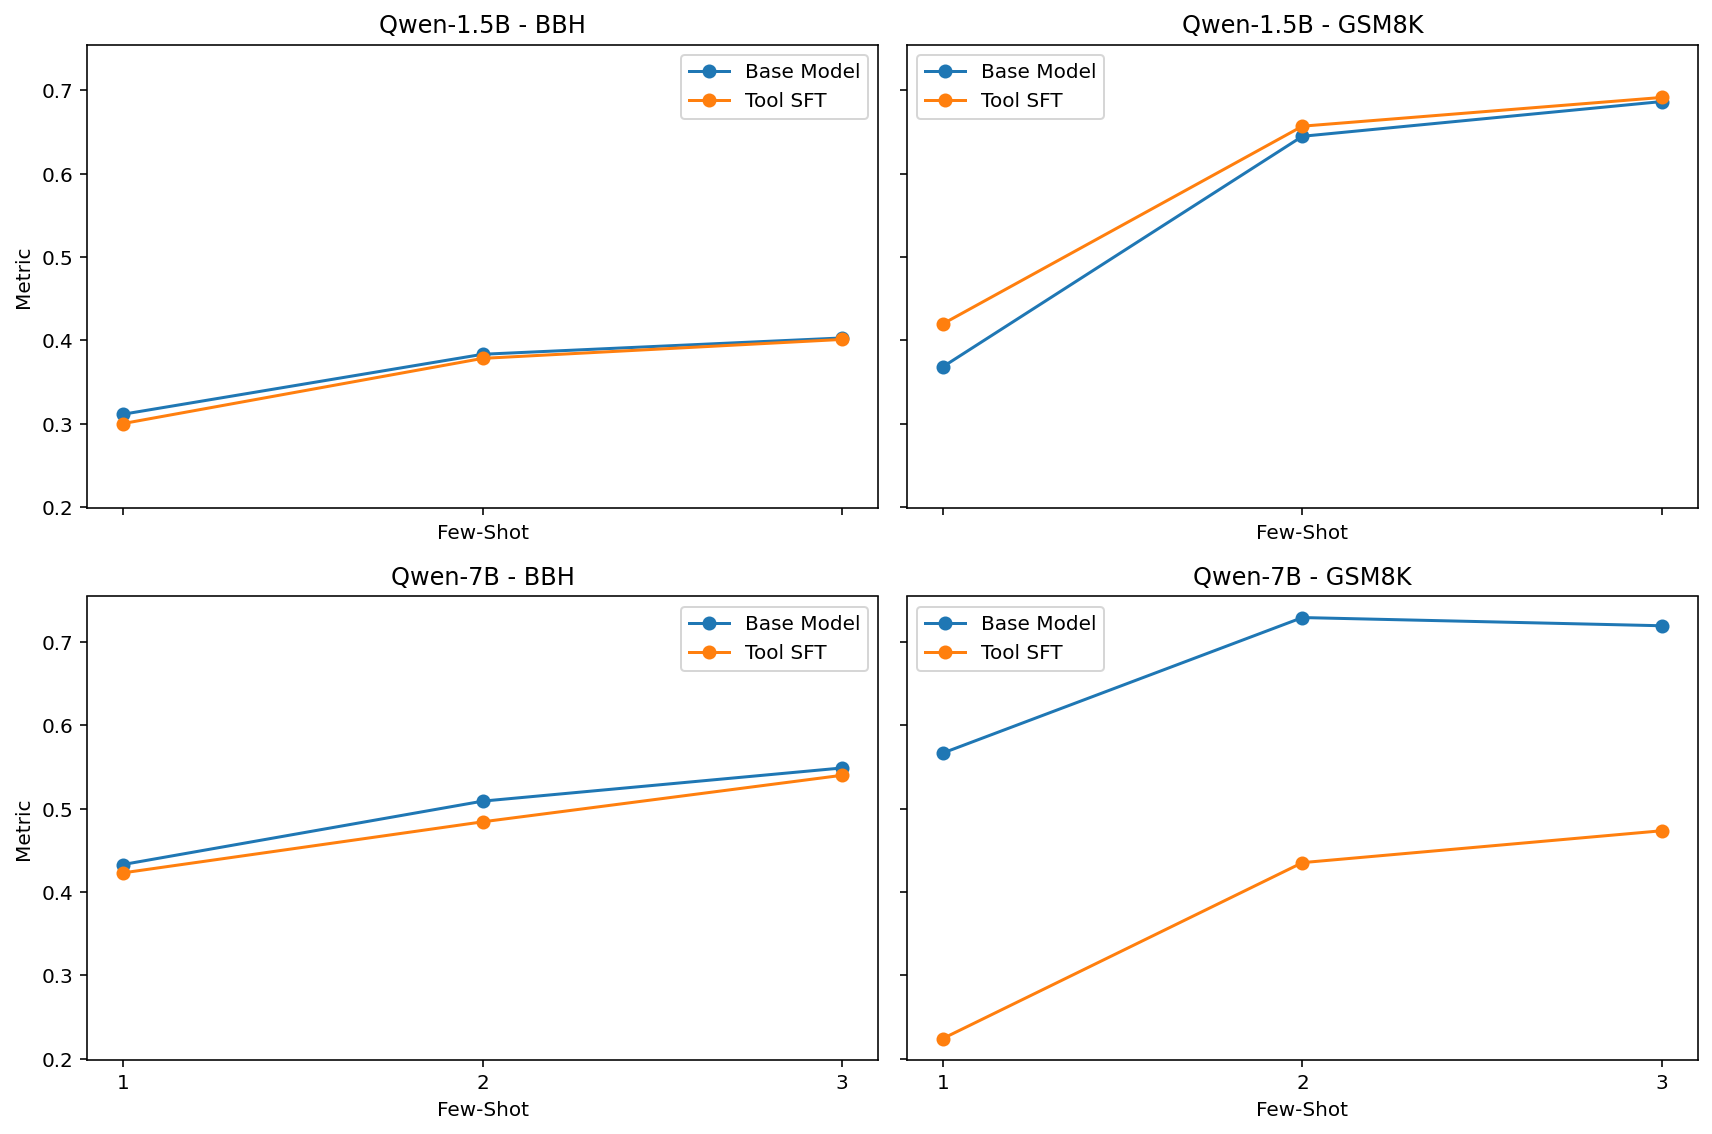
The image contains four line charts arranged in a 2x2 grid. Each chart compares the performance of a "Base Model" and a "Tool SFT" model across different "Few-Shot" settings (1, 2, and 3). The charts vary by model size (Qwen-1.5B and Qwen-7B) and dataset (BBH and GSM8K). The y-axis represents a "Metric" without specifying what it measures.
### Components/Axes
* **Chart Titles (Top-Left to Bottom-Right):**
* Qwen-1.5B - BBH
* Qwen-1.5B - GSM8K
* Qwen-7B - BBH
* Qwen-7B - GSM8K
* **X-Axis:** "Few-Shot" with markers at 1, 2, and 3.
* **Y-Axis:** "Metric" with a scale from 0.2 to 0.7.
* **Legend (Present in all charts, top-right):**
* Blue: "Base Model"
* Orange: "Tool SFT"
### Detailed Analysis
**Chart 1: Qwen-1.5B - BBH**
* **Base Model (Blue):** The line slopes slightly upward.
* Few-Shot 1: ~0.31
* Few-Shot 2: ~0.38
* Few-Shot 3: ~0.40
* **Tool SFT (Orange):** The line slopes slightly upward, closely tracking the Base Model.
* Few-Shot 1: ~0.30
* Few-Shot 2: ~0.38
* Few-Shot 3: ~0.41
**Chart 2: Qwen-1.5B - GSM8K**
* **Base Model (Blue):** The line slopes sharply upward from 1 to 2, then plateaus.
* Few-Shot 1: ~0.37
* Few-Shot 2: ~0.65
* Few-Shot 3: ~0.69
* **Tool SFT (Orange):** The line slopes sharply upward from 1 to 2, then plateaus, closely tracking the Base Model.
* Few-Shot 1: ~0.42
* Few-Shot 2: ~0.66
* Few-Shot 3: ~0.70
**Chart 3: Qwen-7B - BBH**
* **Base Model (Blue):** The line slopes upward.
* Few-Shot 1: ~0.43
* Few-Shot 2: ~0.51
* Few-Shot 3: ~0.55
* **Tool SFT (Orange):** The line slopes upward, closely tracking the Base Model.
* Few-Shot 1: ~0.43
* Few-Shot 2: ~0.49
* Few-Shot 3: ~0.54
**Chart 4: Qwen-7B - GSM8K**
* **Base Model (Blue):** The line slopes sharply upward from 1 to 2, then plateaus.
* Few-Shot 1: ~0.57
* Few-Shot 2: ~0.72
* Few-Shot 3: ~0.72
* **Tool SFT (Orange):** The line slopes sharply upward from 1 to 2, then plateaus.
* Few-Shot 1: ~0.23
* Few-Shot 2: ~0.44
* Few-Shot 3: ~0.48
### Key Observations
* For both Qwen-1.5B and Qwen-7B, performance on GSM8K improves significantly with the increase from 1 to 2 few-shot examples, then plateaus.
* Performance on BBH improves more gradually with increasing few-shot examples.
* The "Tool SFT" model generally performs similarly to the "Base Model," with some exceptions. For Qwen-7B on GSM8K, the Tool SFT model starts with a significantly lower metric at 1 few-shot.
### Interpretation
The charts compare the performance of Qwen models with different sizes (1.5B and 7B parameters) on two datasets (BBH and GSM8K) under few-shot learning conditions. The "Tool SFT" likely refers to a version of the model that has been fine-tuned using a specific set of tools or techniques.
The data suggests that:
* The GSM8K dataset benefits more from increased few-shot examples than the BBH dataset, especially in the initial increase from 1 to 2 examples. This could indicate that GSM8K requires more context or examples to achieve good performance.
* The "Tool SFT" fine-tuning generally improves or maintains performance compared to the base model. The exception of Qwen-7B on GSM8K at 1-shot suggests that the fine-tuning process might require a minimum number of examples to be effective in some cases.
* The plateauing effect observed on GSM8K after 2 few-shot examples suggests that there might be diminishing returns in increasing the number of examples beyond a certain point for this dataset.