## Line Charts: Performance Comparison of Qwen Models (Base vs. Tool SFT)
### Overview
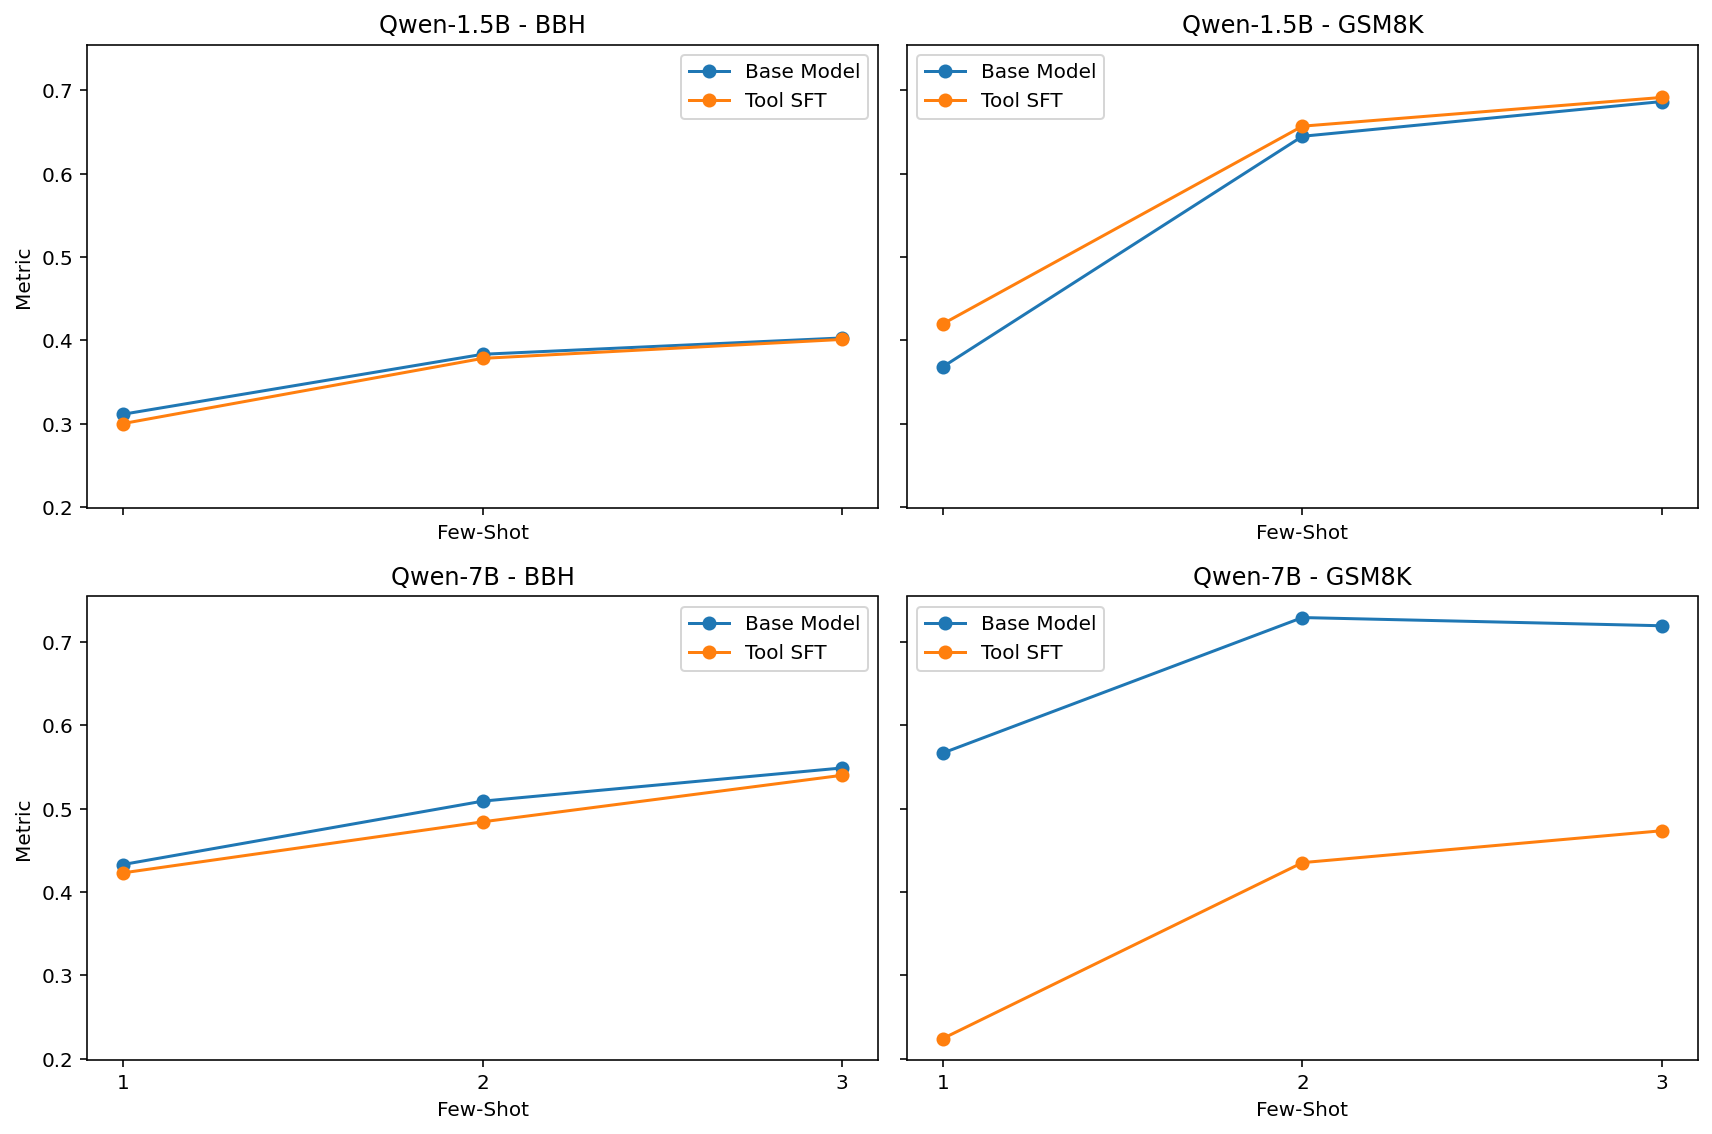
The image consists of a 2x2 grid of line charts comparing the performance of two language model variants ("Base Model" and "Tool SFT") across two different model sizes (Qwen-1.5B and Qwen-7B) and two different evaluation benchmarks (BBH and GSM8K). The performance is measured across varying numbers of "Few-Shot" examples.
### Components/Axes
The image is divided into four distinct subplots.
**Shared Elements:**
* **X-Axis (Horizontal):** Labeled "Few-Shot". The bottom row explicitly shows tick marks for `1`, `2`, and `3`. The top row shares this axis alignment, though the numbers are omitted to save space.
* **Y-Axis (Vertical):** Labeled "Metric". The left column explicitly shows tick marks ranging from `0.2` to `0.7` in increments of `0.1`. The right column shares this vertical scale, though the labels are omitted.
* **Legend:** Each subplot contains a legend.
* **Blue line with circular markers:** `Base Model`
* **Orange line with circular markers:** `Tool SFT`
* *Spatial Grounding:* In the BBH charts (left column), the legend is positioned in the top-right corner. In the GSM8K charts (right column), the legend is positioned in the top-left corner to avoid overlapping the data lines.
---
### Detailed Analysis by Component
#### 1. Top-Left Quadrant: Qwen-1.5B - BBH
* **Header/Title:** `Qwen-1.5B - BBH`
* **Trend Verification:** Both the Base Model (blue) and Tool SFT (orange) lines slope gently upward from 1-shot to 2-shot, and continue a very slight upward slope to 3-shot. The lines are nearly identical, with the Base Model starting slightly higher at 1-shot before they converge.
* **Data Points (Approximate):**
* **Base Model (Blue):** 1-shot: ~0.31 | 2-shot: ~0.38 | 3-shot: ~0.40
* **Tool SFT (Orange):** 1-shot: ~0.30 | 2-shot: ~0.38 | 3-shot: ~0.40
#### 2. Top-Right Quadrant: Qwen-1.5B - GSM8K
* **Header/Title:** `Qwen-1.5B - GSM8K`
* **Trend Verification:** Both lines exhibit a steep upward slope from 1-shot to 2-shot, followed by a shallower upward slope to 3-shot. The Tool SFT (orange) line remains consistently above the Base Model (blue) line across all points, though the gap narrows slightly at 3-shot.
* **Data Points (Approximate):**
* **Base Model (Blue):** 1-shot: ~0.37 | 2-shot: ~0.64 | 3-shot: ~0.68
* **Tool SFT (Orange):** 1-shot: ~0.42 | 2-shot: ~0.66 | 3-shot: ~0.69
#### 3. Bottom-Left Quadrant: Qwen-7B - BBH
* **Header/Title:** `Qwen-7B - BBH`
* **Trend Verification:** Both lines slope steadily upward from 1-shot to 3-shot. The Base Model (blue) line remains consistently, though slightly, above the Tool SFT (orange) line across all data points.
* **Data Points (Approximate):**
* **Base Model (Blue):** 1-shot: ~0.43 | 2-shot: ~0.51 | 3-shot: ~0.55
* **Tool SFT (Orange):** 1-shot: ~0.42 | 2-shot: ~0.48 | 3-shot: ~0.54
#### 4. Bottom-Right Quadrant: Qwen-7B - GSM8K
* **Header/Title:** `Qwen-7B - GSM8K`
* **Trend Verification:** This chart shows the most significant divergence. The Base Model (blue) slopes steeply upward from 1 to 2, then slightly *downward* from 2 to 3. The Tool SFT (orange) line slopes upward from 1 to 2, and continues upward to 3. Crucially, the Base Model is drastically higher than the Tool SFT model at every point.
* **Data Points (Approximate):**
* **Base Model (Blue):** 1-shot: ~0.57 | 2-shot: ~0.73 | 3-shot: ~0.72
* **Tool SFT (Orange):** 1-shot: ~0.22 | 2-shot: ~0.43 | 3-shot: ~0.47
---
### Key Observations
1. **Few-Shot Efficacy:** Across almost all models and benchmarks, increasing the number of few-shot examples from 1 to 2 yields a significant performance increase. The gain from 2 to 3 is generally marginal (and slightly negative for Qwen-7B Base on GSM8K).
2. **The GSM8K Anomaly (7B Model):** The most striking visual outlier is in the bottom-right chart. Applying "Tool SFT" to the Qwen-7B model causes a massive degradation in performance on the GSM8K benchmark compared to its Base Model counterpart (a drop of roughly 0.30 to 0.35 points across all few-shot settings).
3. **Varying Impact of Tool SFT:**
* On the 1.5B model, Tool SFT slightly *improves* GSM8K performance and has negligible impact on BBH.
* On the 7B model, Tool SFT slightly *degrades* BBH performance and severely *degrades* GSM8K performance.
### Interpretation
The data presented in these charts illustrates a classic problem in Large Language Model (LLM) fine-tuning: **alignment tax or catastrophic forgetting**.
"Tool SFT" likely refers to Supervised Fine-Tuning designed to teach the model how to use external tools (like calculators or APIs).
* For the smaller **1.5B model**, this fine-tuning appears beneficial or neutral. It actually helps the model on GSM8K (a math word problem benchmark), perhaps because the tool training helped structure its reasoning.
* However, for the larger **7B model**, the Tool SFT process severely damaged its inherent ability to solve GSM8K problems. This suggests that the fine-tuning data distribution for tool use conflicted with the model's pre-existing mathematical reasoning capabilities, causing it to "forget" or overwrite those skills.
* The BBH (BigBench Hard) benchmark, which tests a broader variety of reasoning tasks, was relatively unaffected by the Tool SFT process across both model sizes, indicating that the degradation is highly specific to the skills required for GSM8K.
Ultimately, this document serves as a cautionary visualization for AI researchers: fine-tuning a model for a specific new capability (tool use) can result in severe, unexpected regressions in core capabilities (math reasoning), particularly as model scale increases.