## Line Chart: Qwen Model Performance on BBH and GSM8K
### Overview
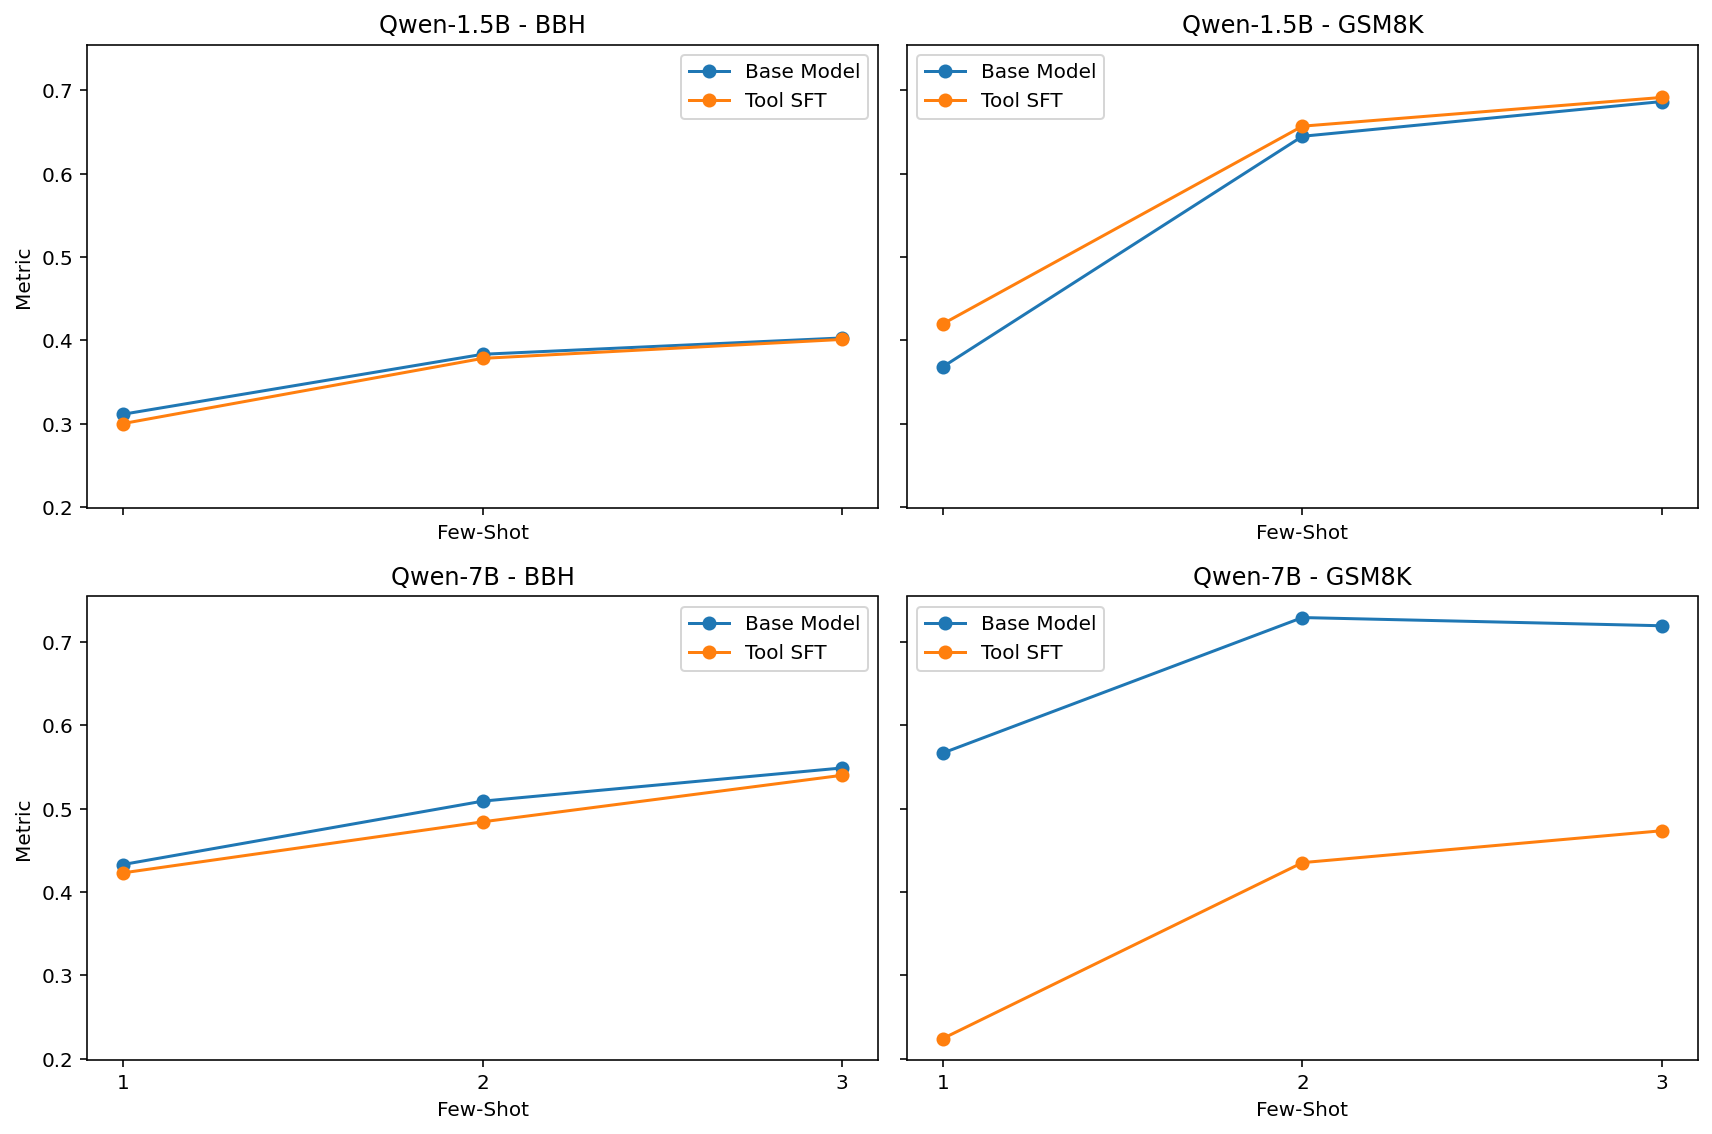
The image presents four line charts comparing the performance of "Base Model" and "Tool SFT" versions of the Qwen language model (1.5B and 7B parameters) on two benchmarks: BBH (BigBench Hard) and GSM8K (Grade School Math 8K). The x-axis represents the "Few-Shot" setting (1, 2, or 3 examples), and the y-axis represents a generic "Metric" score. Each chart visualizes the performance of both model versions as the number of few-shot examples increases.
### Components/Axes
* **X-axis:** "Few-Shot" with markers at 1, 2, and 3.
* **Y-axis:** "Metric" with a scale ranging from approximately 0.2 to 0.7.
* **Charts:** Four separate line charts, arranged in a 2x2 grid.
* Top-Left: Qwen-1.5B - BBH
* Top-Right: Qwen-1.5B - GSM8K
* Bottom-Left: Qwen-7B - BBH
* Bottom-Right: Qwen-7B - GSM8K
* **Legend:** Each chart has a legend in the top-right corner, indicating:
* Blue Line: "Base Model"
* Orange Line: "Tool SFT"
### Detailed Analysis or Content Details
**Qwen-1.5B - BBH (Top-Left)**
* The "Base Model" (blue line) shows a slight upward trend, starting at approximately 0.32 at Few-Shot=1, rising to around 0.38 at Few-Shot=3.
* The "Tool SFT" (orange line) starts at approximately 0.35 at Few-Shot=1, increases to around 0.42 at Few-Shot=2, and then plateaus at approximately 0.42 at Few-Shot=3.
**Qwen-1.5B - GSM8K (Top-Right)**
* The "Base Model" (blue line) starts at approximately 0.42 at Few-Shot=1, increases sharply to around 0.62 at Few-Shot=2, and then plateaus at approximately 0.64 at Few-Shot=3.
* The "Tool SFT" (orange line) starts at approximately 0.32 at Few-Shot=1, increases sharply to around 0.60 at Few-Shot=2, and then increases slightly to approximately 0.63 at Few-Shot=3.
**Qwen-7B - BBH (Bottom-Left)**
* The "Base Model" (blue line) starts at approximately 0.41 at Few-Shot=1, decreases slightly to around 0.40 at Few-Shot=2, and then increases to approximately 0.51 at Few-Shot=3.
* The "Tool SFT" (orange line) starts at approximately 0.38 at Few-Shot=1, remains relatively stable at around 0.40 at Few-Shot=2, and then increases to approximately 0.50 at Few-Shot=3.
**Qwen-7B - GSM8K (Bottom-Right)**
* The "Base Model" (blue line) starts at approximately 0.54 at Few-Shot=1, decreases slightly to around 0.52 at Few-Shot=2, and then increases to approximately 0.56 at Few-Shot=3.
* The "Tool SFT" (orange line) starts at approximately 0.40 at Few-Shot=1, increases sharply to around 0.55 at Few-Shot=2, and then increases slightly to approximately 0.58 at Few-Shot=3.
### Key Observations
* The "Tool SFT" model consistently outperforms the "Base Model" on GSM8K, especially with 2 or 3 few-shot examples.
* On BBH, the performance difference between the two models is less pronounced, and the "Base Model" sometimes outperforms the "Tool SFT" at higher few-shot settings (Qwen-7B).
* The GSM8K benchmark shows a more significant improvement with increasing few-shot examples for both models.
* The BBH benchmark shows less consistent improvement with increasing few-shot examples.
### Interpretation
The data suggests that the "Tool SFT" fine-tuning strategy is particularly effective for improving performance on the GSM8K benchmark, which requires mathematical reasoning. The larger performance gains on GSM8K with more few-shot examples indicate that the model benefits from seeing more examples of how to solve math problems. The relatively smaller gains on BBH suggest that the "Tool SFT" strategy may be less effective for tasks requiring broader reasoning abilities. The slight performance fluctuations in the "Base Model" on BBH (Qwen-7B) could be due to the inherent difficulty of the benchmark and the limited number of few-shot examples. The consistent outperformance of "Tool SFT" on GSM8K suggests that the tool-augmented training process is successfully equipping the model with the ability to leverage external tools for mathematical problem-solving.