## Line Charts: Performance of Qwen Models on BBH and GSM8K Benchmarks
### Overview
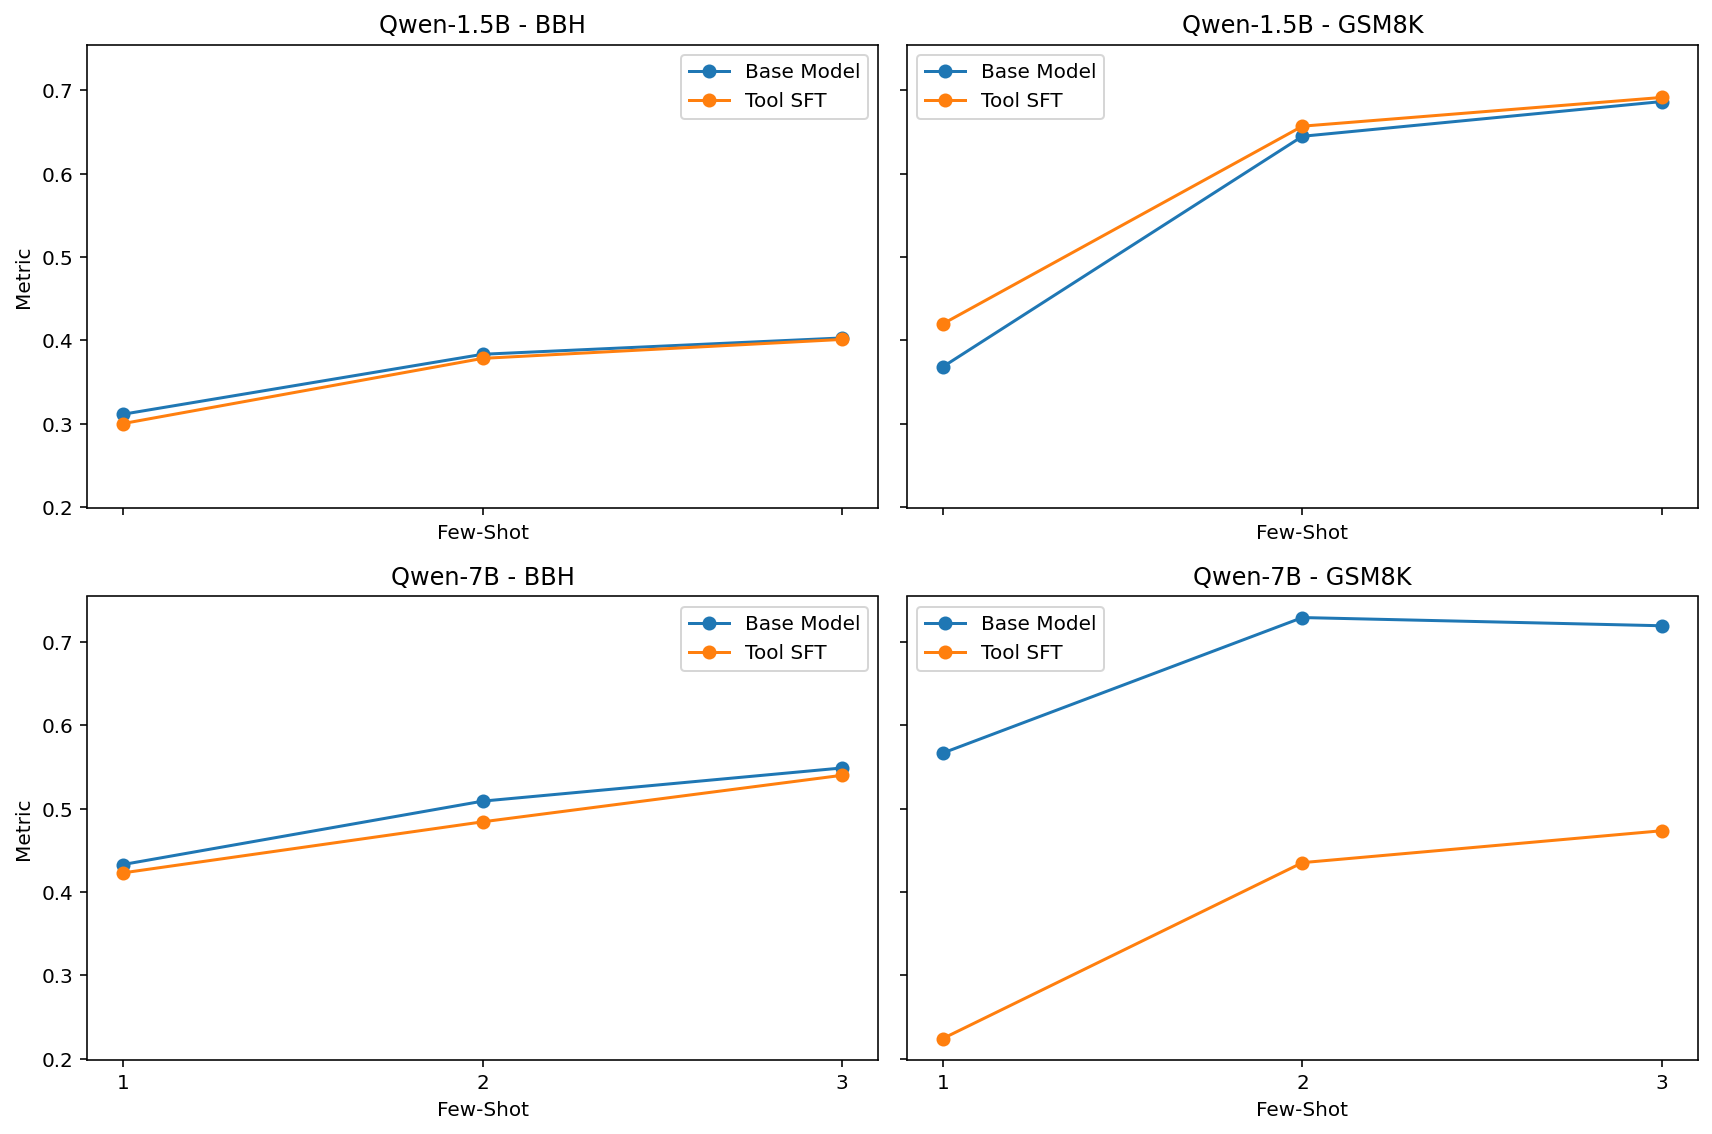
The image displays a 2x2 grid of four line charts. Each chart compares the performance of two model variants ("Base Model" and "Tool SFT") across three different "Few-Shot" settings (1, 2, and 3 examples). The charts are organized by model size (Qwen-1.5B and Qwen-7B) and evaluation dataset (BBH and GSM8K). The y-axis represents a performance "Metric" (likely accuracy or a similar score), and the x-axis represents the number of few-shot examples provided.
### Components/Axes
* **Titles (Top of each subplot):**
* Top-Left: `Qwen-1.5B - BBH`
* Top-Right: `Qwen-1.5B - GSM8K`
* Bottom-Left: `Qwen-7B - BBH`
* Bottom-Right: `Qwen-7B - GSM8K`
* **Y-Axis Label (Left side of each subplot):** `Metric`
* **X-Axis Label (Bottom of each subplot):** `Few-Shot`
* **X-Axis Markers (Bottom row charts):** `1`, `2`, `3`. The top row charts share the same x-axis scale but do not have explicit numerical labels.
* **Legend (Top-right corner of each subplot):**
* Blue line with circle markers: `Base Model`
* Orange line with circle markers: `Tool SFT`
### Detailed Analysis
**1. Qwen-1.5B - BBH (Top-Left Chart)**
* **Trend:** Both lines show a steady, moderate upward trend as few-shot examples increase.
* **Data Points (Approximate):**
* **Few-Shot 1:** Base Model ≈ 0.31, Tool SFT ≈ 0.30
* **Few-Shot 2:** Base Model ≈ 0.38, Tool SFT ≈ 0.38
* **Few-Shot 3:** Base Model ≈ 0.40, Tool SFT ≈ 0.40
* **Observation:** The two models perform nearly identically, with the Base Model having a negligible lead at 1-shot.
**2. Qwen-1.5B - GSM8K (Top-Right Chart)**
* **Trend:** Both lines show a steep upward trend, especially between 1-shot and 2-shot, followed by a gentler slope to 3-shot.
* **Data Points (Approximate):**
* **Few-Shot 1:** Base Model ≈ 0.37, Tool SFT ≈ 0.42
* **Few-Shot 2:** Base Model ≈ 0.65, Tool SFT ≈ 0.66
* **Few-Shot 3:** Base Model ≈ 0.69, Tool SFT ≈ 0.70
* **Observation:** Tool SFT consistently outperforms the Base Model by a small margin across all few-shot settings. The performance jump from 1-shot to 2-shot is substantial for both.
**3. Qwen-7B - BBH (Bottom-Left Chart)**
* **Trend:** Both lines show a steady upward trend.
* **Data Points (Approximate):**
* **Few-Shot 1:** Base Model ≈ 0.43, Tool SFT ≈ 0.42
* **Few-Shot 2:** Base Model ≈ 0.51, Tool SFT ≈ 0.48
* **Few-Shot 3:** Base Model ≈ 0.55, Tool SFT ≈ 0.54
* **Observation:** The Base Model maintains a consistent, small performance advantage over Tool SFT across all few-shot settings.
**4. Qwen-7B - GSM8K (Bottom-Right Chart)**
* **Trend:** The Base Model line shows a sharp increase from 1-shot to 2-shot and then plateaus. The Tool SFT line shows a steady, moderate increase.
* **Data Points (Approximate):**
* **Few-Shot 1:** Base Model ≈ 0.57, Tool SFT ≈ 0.22
* **Few-Shot 2:** Base Model ≈ 0.73, Tool SFT ≈ 0.44
* **Few-Shot 3:** Base Model ≈ 0.72, Tool SFT ≈ 0.48
* **Observation:** This chart shows the most significant divergence. The Base Model dramatically outperforms Tool SFT. The Tool SFT variant starts at a very low performance level (≈0.22) and, while improving, never approaches the Base Model's performance.
### Key Observations
1. **Dataset Sensitivity:** Performance gains from few-shot examples are much larger on the GSM8K dataset (mathematical reasoning) than on the BBH dataset for both model sizes.
2. **Model Size Scaling:** The larger Qwen-7B model achieves higher absolute metric scores than the Qwen-1.5B model on both datasets, as expected.
3. **Tool SFT Efficacy is Inconsistent:** The effect of "Tool SFT" is not uniform.
* On **Qwen-1.5B**, it provides a slight benefit on GSM8K and is neutral on BBH.
* On **Qwen-7B**, it is slightly detrimental on BBH and **severely detrimental** on GSM8K.
4. **Anomaly:** The performance of Tool SFT on Qwen-7B for GSM8K is a clear outlier. Its starting point (1-shot) is exceptionally low, and it fails to converge with the Base Model even with more examples.
### Interpretation
The data suggests that the "Tool SFT" (likely Supervised Fine-Tuning with tool-use data) technique has a complex, model-size-dependent interaction with in-context learning capabilities.
* For the smaller model (1.5B), Tool SFT appears to be a mild enhancement for mathematical reasoning (GSM8K) without harming other reasoning (BBH). This could indicate that the smaller model benefits from the structured guidance provided by tool-use training.
* For the larger model (7B), the opposite occurs. Tool SFT appears to **interfere** with the model's inherent few-shot learning ability, particularly on GSM8K. This is a critical finding. It may imply that the fine-tuning process disrupts the model's internal reasoning pathways or that the tool-use data is misaligned with the model's existing capabilities at this scale. The larger model's superior base performance suggests it has stronger intrinsic reasoning, which the Tool SFT process may inadvertently suppress.
In summary, the charts demonstrate that more parameters and more few-shot examples generally improve performance, but the application of specialized fine-tuning (Tool SFT) is not a guaranteed improvement and can be harmful, especially for larger, more capable base models on specific tasks. The results highlight the importance of evaluating fine-tuning techniques across different model scales and benchmarks.