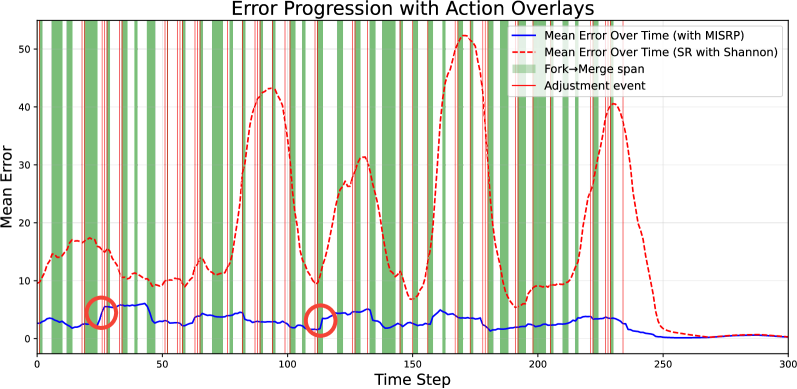
## [Line Chart]: Error Progression with Action Overlays
### Overview
The chart visualizes the **mean error over time** (x-axis: *Time Step*, y-axis: *Mean Error*) for two methods, with overlays of operational events (fork→merge spans, adjustment events). It compares the stability and magnitude of error between “Mean Error Over Time (with MISRP)” (blue line) and “Mean Error Over Time (SR with Shannon)” (red dashed line).
### Components/Axes
- **Title**: *Error Progression with Action Overlays*
- **X-axis**: *Time Step* (ticks: 0, 50, 100, 150, 200, 250, 300)
- **Y-axis**: *Mean Error* (ticks: 0, 10, 20, 30, 40, 50)
- **Legend** (top-right):
- Blue solid line: *Mean Error Over Time (with MISRP)*
- Red dashed line: *Mean Error Over Time (SR with Shannon)*
- Green vertical bars: *Fork→Merge span* (operational event)
- Red vertical lines: *Adjustment event* (operational event)
- **Overlays**:
- Green vertical bars (Fork→Merge spans) and red vertical lines (Adjustment events) are densely overlaid (especially 0–250 time steps).
- Two red circles highlight points on the blue line (≈Time Step 30 and 110).
### Detailed Analysis
#### Blue Line (MISRP)
- **Trend**: Stable, low error (mostly 0–10).
- **Key Points**:
- At Time Step ≈30 (red circle): Error ≈5.
- At Time Step ≈110 (red circle): Error ≈5.
- After Time Step 250: Error approaches 0.
#### Red Dashed Line (SR with Shannon)
- **Trend**: Highly variable, with large error spikes.
- **Key Points**:
- Peaks: ≈Time Step 100 (error ≈45), 150 (error ≈50), 200 (error ≈40).
- Troughs: ≈Time Step 50 (error ≈10), 150 (error ≈10), 200 (error ≈5).
- After Time Step 250: Error approaches 0.
#### Overlays
- Green bars (Fork→Merge spans) and red lines (Adjustment events) are frequent (0–250 time steps), often coinciding.
### Key Observations
- **Stability**: The blue line (MISRP) is far more stable (low, consistent error) than the red line (SR with Shannon).
- **Spikes**: The red line has dramatic error spikes (up to ~50) during fork→merge/adjustment events.
- **Convergence**: Both lines converge to near-zero error after Time Step 250.
### Interpretation
- **Method Comparison**: MISRP (blue) outperforms SR with Shannon (red) in error stability and magnitude, especially during operational events (fork→merge, adjustment).
- **Event Impact**: The red line’s spikes suggest SR with Shannon is sensitive to operational events, while MISRP is robust.
- **Stabilization**: Convergence after Time Step 250 may indicate a process end or stabilization phase.
This description captures all visual elements, trends, and relationships, enabling reconstruction of the chart’s information without the image.