## Line Graph: Error Progression with Action Overlays
### Overview
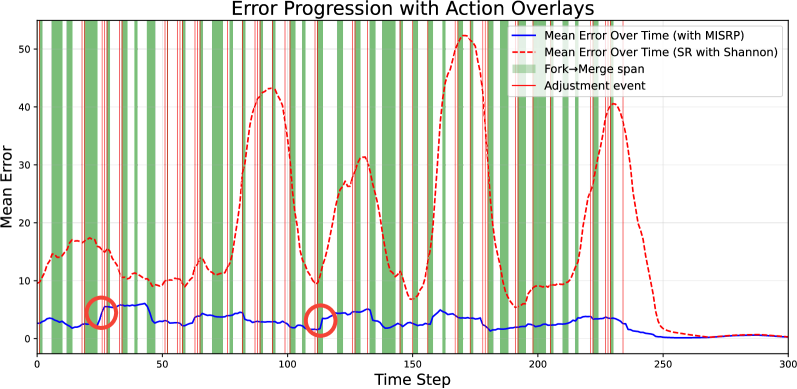
The image is a line graph comparing two error progression metrics over time steps (0–300). It includes overlays for "Fork-Merge span" (green vertical bars) and "Adjustment event" (red vertical lines). Two red circles highlight specific points on the blue line.
### Components/Axes
- **X-axis**: Time Step (0–300, linear scale).
- **Y-axis**: Mean Error (0–50, linear scale).
- **Legend**:
- Solid blue line: "Mean Error Over Time (with MISRP)".
- Dashed red line: "Mean Error Over Time (SR with Shannon)".
- Green vertical bars: "Fork-Merge span".
- Red vertical lines: "Adjustment event".
### Detailed Analysis
1. **Blue Line (MISRP)**:
- Starts at ~15 (time step 0), dips to ~5 at time step 30 (highlighted by red circle), fluctuates between 2–8 until time step 110 (another red circle at ~3), then trends downward to ~1 by time step 300.
- Notable peaks: ~10 at time step 50, ~8 at time step 150.
2. **Red Line (Shannon)**:
- Starts at ~10, rises to ~40 at time step 100, drops to ~10 at time step 150, spikes to ~50 at time step 200, then declines to ~2 by time step 300.
- Sharp peaks at time steps 100 and 200.
3. **Overlays**:
- **Fork-Merge spans**: Green vertical bars at irregular intervals (e.g., time steps 20, 60, 140, 220). Width varies (1–5 time steps).
- **Adjustment events**: Red vertical lines at time steps 40, 80, 120, 160, 200, 240. Thickness consistent (~1 time step).
4. **Highlighted Points**:
- Red circle 1: Time step 30, error ~5 (blue line).
- Red circle 2: Time step 110, error ~3 (blue line).
### Key Observations
- The blue line (MISRP) shows a **general downward trend** with localized fluctuations, while the red line (Shannon) exhibits **high volatility** with two dominant peaks.
- Fork-Merge spans and Adjustment events align with spikes in the red line but not consistently with the blue line.
- The two highlighted points on the blue line represent **local minima** during periods of high error in the red line.
### Interpretation
- **Method Comparison**: MISRP (blue) demonstrates **lower and more stable error progression** compared to Shannon (red), which suffers from **catastrophic spikes** at critical time steps (100, 200). This suggests MISRP may be more robust in dynamic environments.
- **Fork-Merge Spans**: These periods (green bars) correlate with increased error in the Shannon method but not MISRP, implying Fork-Merge events may exacerbate instability in the Shannon approach.
- **Adjustment Events**: Red vertical lines (Adjustment events) occur at time steps where the red line peaks (e.g., 100, 200), suggesting these interventions are reactive to high-error states in the Shannon method.
- **Highlighted Minima**: The circled points on the blue line (time steps 30, 110) indicate **temporary stabilization** in MISRP despite overall volatility, possibly due to adaptive mechanisms.
## Conclusion
The graph highlights the **superior stability of MISRP** over Shannon in managing error progression, particularly during Fork-Merge spans and Adjustment events. The highlighted minima suggest MISRP’s ability to recover from errors, while Shannon’s spikes indicate systemic vulnerabilities. Further analysis could explore the causal relationship between Fork-Merge events and error spikes in the Shannon method.