\n
## Chart: Time Series Data - Price/Value Over Time
### Overview
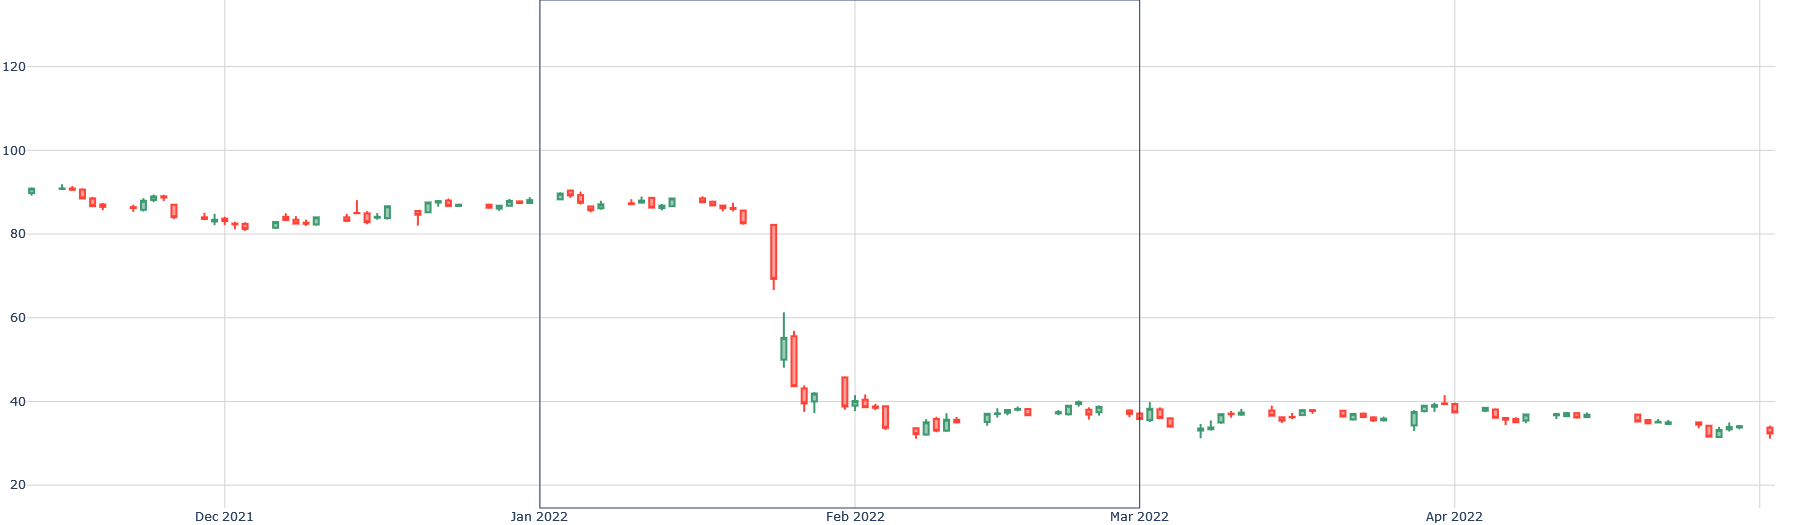
The image presents a time series chart displaying a fluctuating value over a period from approximately December 2021 to April 2022. The chart utilizes a candlestick-style representation, with green candles indicating value increases and red candles indicating value decreases. A vertical gray bar demarcates January 2022, visually separating the earlier period from a significant drop in value.
### Components/Axes
* **X-axis:** Represents time, spanning from December 2021 to April 2022. Specific dates are not labeled, but months are indicated.
* **Y-axis:** Represents the value, ranging from approximately 20 to 120. The axis is linearly scaled.
* **Candlesticks:** Green candlesticks represent periods where the closing value was higher than the opening value. Red candlesticks represent periods where the closing value was lower than the opening value. The "wicks" extending above and below the candlesticks indicate the highest and lowest values reached during that period.
* **Color Coding:** Green indicates positive change (increase in value), and red indicates negative change (decrease in value).
### Detailed Analysis
The chart can be divided into two main phases: before and after January 2022.
**Phase 1: December 2021 - January 2022**
* The value fluctuates between approximately 60 and 90.
* The trend is relatively stable, with small green and red candlesticks indicating minor fluctuations.
* Around the end of January 2022, the value begins to decline.
**Phase 2: February 2022 - April 2022**
* A dramatic drop in value occurs in February 2022, falling from approximately 85 to a low of around 30. This is represented by a large red candlestick.
* Following the drop, the value stabilizes between approximately 30 and 45.
* The trend in this phase is relatively flat, with small green and red candlesticks indicating minor fluctuations around the 35-40 range.
* Towards the end of the chart (April 2022), there is a slight downward trend, with the value decreasing from around 40 to approximately 30.
**Approximate Data Points (estimated from visual inspection):**
* **Dec 2021:** Value fluctuates around 75-85.
* **Early Jan 2022:** Value around 80-90.
* **Late Jan 2022:** Value begins to fall from ~85.
* **Feb 2022 (Low):** Approximately 30.
* **Feb 2022 (High):** Approximately 40.
* **March 2022:** Value fluctuates between 35 and 45.
* **April 2022:** Value decreases from ~40 to ~30.
### Key Observations
* **Significant Drop:** The most prominent feature is the substantial drop in value during February 2022.
* **Stabilization:** After the drop, the value stabilizes, suggesting a potential bottoming-out or consolidation phase.
* **Recent Decline:** A slight downward trend is observed in April 2022, potentially indicating a resumption of the downward momentum.
* **Volatility:** The chart shows a period of low volatility in December 2021 and January 2022, followed by a period of high volatility in February 2022.
### Interpretation
The chart likely represents the price or value of an asset (e.g., a stock, cryptocurrency, commodity) over time. The dramatic drop in February 2022 could be attributed to a significant market event, negative news, or a change in investor sentiment. The subsequent stabilization suggests that the market may have found a new equilibrium point after the initial shock. The slight decline in April 2022 could indicate renewed selling pressure or a continuation of the previous downward trend.
The vertical gray bar highlighting January 2022 suggests that this month is a key turning point in the asset's performance. The candlestick representation provides a detailed view of the price fluctuations within each period, allowing for a more nuanced understanding of the market dynamics. The data suggests a period of relative stability followed by a sharp correction and subsequent consolidation, with a potential for further decline. Further investigation would be needed to determine the underlying causes of these movements and to assess the future outlook for the asset.