## Candlestick Chart: Stock Price Movement (Dec 2021 - Apr 2022)
### Overview
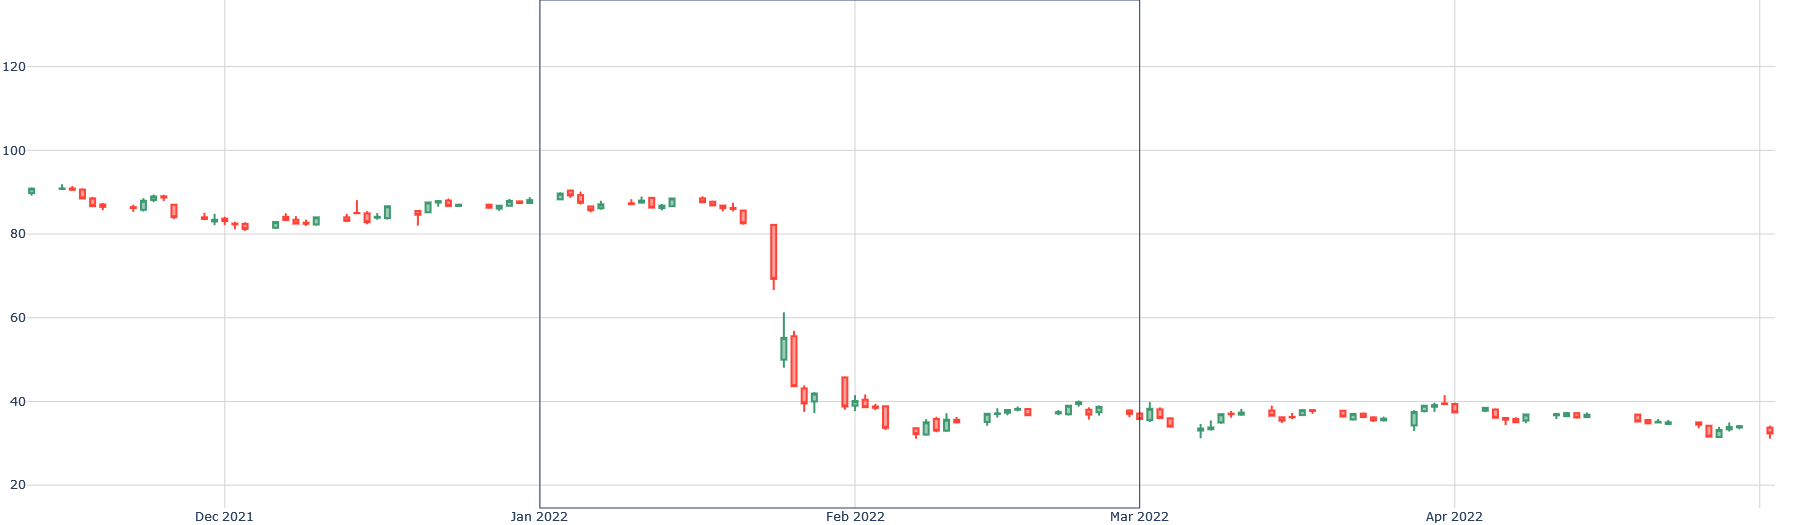
The image displays a candlestick chart tracking stock price movements over six months (December 2021 to April 2022). The chart shows daily price fluctuations with green candlesticks indicating upward movement (closing price > opening price) and red candlesticks indicating downward movement (closing price < opening price). The y-axis represents price in increments of 20, while the x-axis marks time in monthly intervals.
### Components/Axes
- **Y-Axis (Price):** Labeled "Price" with gridlines at 20-unit intervals (0, 20, 40, 60, 80, 100, 120). No explicit units (e.g., USD) are provided.
- **X-Axis (Time):** Labeled with months (Dec 2021, Jan 2022, Feb 2022, Mar 2022, Apr 2022). Days are not explicitly labeled but inferred from candlestick spacing.
- **Legend:** Located on the right side of the chart. Green = upward movement (closing price > opening price), Red = downward movement (closing price < opening price).
### Detailed Analysis
1. **December 2021:**
- Price starts near 90, fluctuates between 80–90, and closes at ~85.
- Green candlesticks dominate early December, followed by red candlesticks toward month-end.
2. **January 2022:**
- Price opens at ~85, peaks at ~90, then drops sharply to ~80.
- Mixed green/red candlesticks, with a notable red candlestick near month-end.
3. **February 2022:**
- Sharp decline from ~80 to ~60, followed by a partial recovery to ~50.
- Large red candlestick in mid-February (price drop from ~80 to ~60).
- Green candlesticks appear in late February, but price remains below 60.
4. **March 2022:**
- Price stabilizes between ~35–40, with minor fluctuations.
- Alternating green/red candlesticks, ending at ~35.
5. **April 2022:**
- Price rises to ~40, then declines to ~30.
- Green candlesticks in early April, followed by red candlesticks toward month-end.
### Key Observations
- **Overall Trend:** Bearish trajectory from December 2021 (starting ~90) to April 2022 (ending ~30), a ~60-point decline.
- **Volatility Peaks:**
- Sharp drop in February 2022 (~80 → ~60).
- Significant rebound in late February (~60 → ~50).
- **Price Range:**
- High: ~90 (Dec 2021).
- Low: ~30 (Apr 2022).
- **Candlestick Patterns:**
- Long red candlesticks in February indicate panic selling.
- Smaller green/red candlesticks in March/April suggest consolidation.
### Interpretation
The chart demonstrates a prolonged bear market with a 67% price decline over six months. The February 2022 crash (80 → 60) suggests a critical event (e.g., earnings report, macroeconomic shock) triggered a sell-off. The subsequent recovery in late February and March/April volatility may reflect short-term trading activity or sector-specific news. The lack of sustained recovery below the 50 mark indicates weak buyer confidence. Investors might interpret this as a high-risk asset with declining fundamentals or external market pressures. The absence of volume data limits analysis of institutional participation.