TECHNICAL ASSET FINGERPRINT
537238dea7012d48302930c7
Click to view fullscreen
Press ESC or click to close
FOUND IN PAPERS
EXPERT: gemini-2.0-flash VERSION 1
RUNTIME: nugit/gemini/gemini-2.0-flash
INTEL_VERIFIED
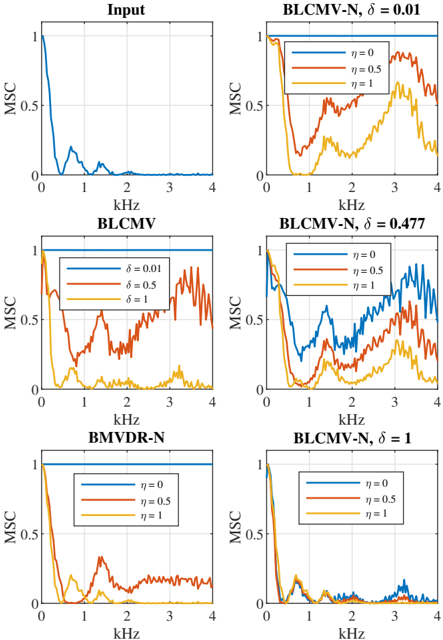
## Chart Type: Multiple MSC vs. kHz Plots
### Overview
The image presents six plots arranged in a 2x3 grid. Each plot displays the Magnitude Squared Coherence (MSC) on the y-axis against frequency in kHz on the x-axis. The plots compare different algorithms (BLCMV, BMVDR-N, and variants) with varying parameters (δ and η).
### Components/Axes
* **Y-axis (MSC):** Ranges from 0 to 1, with a marker at 0.5.
* **X-axis (kHz):** Ranges from 0 to 4 kHz, with markers at each integer value.
* **Titles:** Each plot has a title indicating the algorithm and parameter settings.
* Top-left: "Input"
* Top-middle: "BLCMV-N, δ = 0.01"
* Top-right: "BLCMV-N, δ = 0.477"
* Middle-left: "BLCMV"
* Bottom-left: "BMVDR-N"
* Bottom-right: "BLCMV-N, δ = 1"
* **Legends:**
* BLCMV: δ = 0.01 (blue), δ = 0.5 (red), δ = 1 (yellow)
* BLCMV-N: η = 0 (blue), η = 0.5 (red), η = 1 (yellow)
* BMVDR-N: η = 0 (blue), η = 0.5 (red), η = 1 (yellow)
### Detailed Analysis
**1. Input (Top-Left)**
* Trend: The MSC starts at approximately 1, drops sharply to near 0 around 0.5 kHz, fluctuates between 0 and 0.25 until about 1.5 kHz, and then remains close to 0 for the rest of the range.
* Data Points:
* 0 kHz: ~1
* 0.5 kHz: ~0
* 1 kHz: ~0.2
* 1.5 kHz: ~0
* 4 kHz: ~0
**2. BLCMV-N, δ = 0.01 (Top-Middle)**
* Trend:
* η = 0 (blue): Stays at 1 until about 0.5 kHz, then drops to around 0.2, and rises again to fluctuate between 0.5 and 1.
* η = 0.5 (red): Stays at 1 until about 0.5 kHz, then drops to around 0.1, and rises again to fluctuate between 0.2 and 0.7.
* η = 1 (yellow): Stays at 1 until about 0.5 kHz, then drops to around 0.05, and rises again to fluctuate between 0.1 and 0.6.
* Data Points:
* η = 0 (blue): 0 kHz: 1, 0.5 kHz: ~0.2, 4 kHz: ~0.7
* η = 0.5 (red): 0 kHz: 1, 0.5 kHz: ~0.1, 4 kHz: ~0.4
* η = 1 (yellow): 0 kHz: 1, 0.5 kHz: ~0.05, 4 kHz: ~0.3
**3. BLCMV-N, δ = 0.477 (Top-Right)**
* Trend:
* η = 0 (blue): Stays at 1 until about 0.5 kHz, then drops to around 0.1, and rises again to fluctuate between 0.2 and 1.
* η = 0.5 (red): Stays at 1 until about 0.5 kHz, then drops to around 0.05, and rises again to fluctuate between 0.1 and 0.6.
* η = 1 (yellow): Stays at 1 until about 0.5 kHz, then drops to around 0, and rises again to fluctuate between 0.05 and 0.5.
* Data Points:
* η = 0 (blue): 0 kHz: 1, 0.5 kHz: ~0.1, 4 kHz: ~0.8
* η = 0.5 (red): 0 kHz: 1, 0.5 kHz: ~0.05, 4 kHz: ~0.4
* η = 1 (yellow): 0 kHz: 1, 0.5 kHz: ~0, 4 kHz: ~0.3
**4. BLCMV (Middle-Left)**
* Trend:
* δ = 0.01 (blue): Stays at 1 across the entire frequency range.
* δ = 0.5 (red): Stays at 1 until about 0.5 kHz, then drops to around 0.1, and rises again to fluctuate between 0.1 and 0.7.
* δ = 1 (yellow): Stays at 1 until about 0.5 kHz, then drops to around 0, and rises again to fluctuate between 0 and 0.4.
* Data Points:
* δ = 0.01 (blue): 0 kHz: 1, 4 kHz: 1
* δ = 0.5 (red): 0 kHz: 1, 0.5 kHz: ~0.1, 4 kHz: ~0.4
* δ = 1 (yellow): 0 kHz: 1, 0.5 kHz: ~0, 4 kHz: ~0.2
**5. BMVDR-N (Bottom-Left)**
* Trend:
* η = 0 (blue): Stays at 1 across the entire frequency range.
* η = 0.5 (red): Stays at 1 until about 0.5 kHz, then drops to around 0.05, and rises again to fluctuate between 0.1 and 0.4.
* η = 1 (yellow): Stays at 1 until about 0.5 kHz, then drops to around 0, and rises again to fluctuate between 0 and 0.2.
* Data Points:
* η = 0 (blue): 0 kHz: 1, 4 kHz: 1
* η = 0.5 (red): 0 kHz: 1, 0.5 kHz: ~0.05, 4 kHz: ~0.2
* η = 1 (yellow): 0 kHz: 1, 0.5 kHz: ~0, 4 kHz: ~0.1
**6. BLCMV-N, δ = 1 (Bottom-Right)**
* Trend:
* η = 0 (blue): Stays at 1 until about 0.5 kHz, then drops to around 0, and rises again to fluctuate between 0 and 0.2.
* η = 0.5 (red): Stays at 1 until about 0.5 kHz, then drops to around 0, and rises again to fluctuate between 0 and 0.1.
* η = 1 (yellow): Stays at 1 until about 0.5 kHz, then drops to around 0, and rises again to fluctuate between 0 and 0.1.
* Data Points:
* η = 0 (blue): 0 kHz: 1, 0.5 kHz: ~0, 4 kHz: ~0.1
* η = 0.5 (red): 0 kHz: 1, 0.5 kHz: ~0, 4 kHz: ~0.05
* η = 1 (yellow): 0 kHz: 1, 0.5 kHz: ~0, 4 kHz: ~0.05
### Key Observations
* The "Input" plot shows a significant drop in MSC around 0.5 kHz.
* For BLCMV-N and BMVDR-N, increasing η generally leads to a lower MSC across the frequency range after the initial drop.
* For BLCMV, increasing δ generally leads to a lower MSC across the frequency range after the initial drop.
* When δ = 0.01 for BLCMV, the MSC remains at 1 across the entire frequency range.
* When η = 0 for BMVDR-N, the MSC remains at 1 across the entire frequency range.
* The initial drop in MSC consistently occurs around 0.5 kHz across most plots, except for the cases where the MSC remains at 1.
### Interpretation
The plots illustrate the performance of different algorithms (BLCMV, BMVDR-N, and their variants) in terms of Magnitude Squared Coherence (MSC) across a frequency range of 0-4 kHz. The MSC measures the degree of linear relationship between two signals. A higher MSC indicates a stronger linear relationship.
The "Input" plot likely represents the MSC of the original signal before any processing. The sharp drop around 0.5 kHz suggests a significant change in the signal's characteristics at that frequency.
The other plots show how the different algorithms and parameter settings affect the MSC. The parameters δ and η appear to control the amount of noise reduction or signal modification applied by the algorithms. Increasing these parameters generally leads to a lower MSC, suggesting that the algorithms are reducing the linear coherence of the signal, possibly by removing noise or distorting the signal.
The cases where the MSC remains at 1 across the entire frequency range (BLCMV with δ = 0.01 and BMVDR-N with η = 0) likely represent scenarios where the algorithm is not applying any significant processing to the signal, thus preserving its original coherence.
The consistent drop in MSC around 0.5 kHz across most plots suggests that this frequency range is particularly sensitive to the processing applied by the algorithms.
DECODING INTELLIGENCE...
EXPERT: nemotron-free VERSION 1
RUNTIME: free/nvidia/nemotron-nano-12b-v2-vl:free
INTEL_VERIFIED
## Line Graphs: Comparative Analysis of MSC Across Parameters
### Overview
The image contains six line graphs arranged in two columns and three rows, comparing the Mean Squared Coefficient (MSC) across frequency (kHz) for different parameter configurations. Each graph includes legends with η values (0, 0.5, 1) and varying δ parameters (0.01, 0.477, 1). The graphs are labeled as follows:
- **Top Row**: "Input" (left), "BLCMV-N, δ = 0.01" (right)
- **Middle Row**: "BLCMV" (left), "BLCMV-N, δ = 0.477" (right)
- **Bottom Row**: "BMVDR-N" (left), "BLCMV-N, δ = 1" (right)
### Components/Axes
- **X-Axis**: Labeled "kHz" with a range of 0–4 kHz.
- **Y-Axis**: Labeled "MSC" with a range of 0–1.
- **Legends**: Positioned in the top-right corner of each graph, showing η values (0 = blue, 0.5 = red, 1 = yellow). All graphs include these three η values, though some graphs (e.g., "Input") only display one line (η = 0).
- **Graph Titles**: Located at the top of each graph, specifying the model and δ parameter (e.g., "BLCMV-N, δ = 0.01").
### Detailed Analysis
#### Input Graph (Top-Left)
- **Lines**: Single blue line (η = 0).
- **Trend**: Sharp drop from MSC = 1 to ~0.1 between 0–1 kHz, then stabilizes near 0.
- **Key Points**:
- At 0 kHz: MSC ≈ 1.0
- At 1 kHz: MSC ≈ 0.1
- At 4 kHz: MSC ≈ 0.0
#### BLCMV-N, δ = 0.01 (Top-Right)
- **Lines**:
- Blue (η = 0): Sharp drop to ~0.1 by 1 kHz, then stabilizes.
- Red (η = 0.5): Peaks at ~0.8 MSC around 1.5 kHz, then declines.
- Yellow (η = 1): Peaks at ~0.6 MSC around 2.5 kHz, then declines.
- **Key Points**:
- η = 0.5 peak: 1.5 kHz, MSC ≈ 0.8
- η = 1 peak: 2.5 kHz, MSC ≈ 0.6
#### BLCMV (Middle-Left)
- **Lines**:
- Blue (η = 0): Sharp drop to ~0.1 by 1 kHz, then stabilizes.
- Red (η = 0.5): Oscillates between 0.3–0.7 MSC up to 3 kHz.
- Yellow (η = 1): Oscillates between 0.1–0.5 MSC up to 4 kHz.
- **Key Points**:
- η = 0.5: Peaks at ~0.7 MSC around 2 kHz.
- η = 1: Peaks at ~0.5 MSC around 3 kHz.
#### BLCMV-N, δ = 0.477 (Middle-Right)
- **Lines**:
- Blue (η = 0): Sharp drop to ~0.1 by 1 kHz, then stabilizes.
- Red (η = 0.5): Oscillates between 0.4–0.8 MSC up to 3 kHz.
- Yellow (η = 1): Oscillates between 0.2–0.6 MSC up to 4 kHz.
- **Key Points**:
- η = 0.5: Peaks at ~0.8 MSC around 2.5 kHz.
- η = 1: Peaks at ~0.6 MSC around 3.5 kHz.
#### BMVDR-N (Bottom-Left)
- **Lines**:
- Blue (η = 0): Sharp drop to ~0.1 by 1 kHz, then stabilizes.
- Red (η = 0.5): Peaks at ~0.7 MSC around 1.5 kHz, then declines.
- Yellow (η = 1): Peaks at ~0.5 MSC around 2.5 kHz, then declines.
- **Key Points**:
- η = 0.5 peak: 1.5 kHz, MSC ≈ 0.7
- η = 1 peak: 2.5 kHz, MSC ≈ 0.5
#### BLCMV-N, δ = 1 (Bottom-Right)
- **Lines**:
- Blue (η = 0): Sharp drop to ~0.1 by 1 kHz, then stabilizes.
- Red (η = 0.5): Sharp drop to ~0.3 by 1.5 kHz, then oscillates between 0.2–0.4.
- Yellow (η = 1): Sharp drop to ~0.2 by 1.5 kHz, then oscillates between 0.1–0.3.
- **Key Points**:
- η = 0.5: Peaks at ~0.3 MSC around 2 kHz.
- η = 1: Peaks at ~0.3 MSC around 3 kHz.
### Key Observations
1. **Input Baseline**: The "Input" graph shows a universal sharp drop in MSC, serving as a reference for unmodified signals.
2. **δ Parameter Impact**: Higher δ values (e.g., δ = 1) result in sharper MSC drops and reduced oscillations compared to lower δ values (e.g., δ = 0.01).
3. **η Parameter Impact**:
- η = 0.5 and η = 1 introduce frequency-dependent oscillations, with peaks shifting to higher frequencies as η increases.
- η = 0.5 consistently shows higher MSC peaks than η = 1 across most graphs.
4. **Model-Specific Behavior**:
- **BLCMV-N**: δ modulates the sharpness of the MSC drop and the amplitude of oscillations.
- **BLCMV**: η introduces sustained oscillations without δ influence.
- **BMVDR-N**: η = 0.5 and η = 1 exhibit similar peak frequencies but lower amplitudes compared to BLCMV-N variants.
### Interpretation
The data demonstrates that:
- **δ** acts as a threshold parameter, controlling the initial MSC drop and the persistence of oscillations. Higher δ values suppress oscillations more aggressively.
- **η** modulates the frequency response, with higher η values shifting peak MSC to higher frequencies and reducing peak amplitudes.
- The "Input" graph establishes a baseline MSC profile, while parameterized models (BLCMV-N, BLCMV, BMVDR-N) show how η and δ jointly shape the MSC across frequencies. This suggests δ fine-tunes the system's sensitivity, while η adjusts the frequency-dependent behavior.
- Outliers (e.g., sharp peaks in BLCMV-N, δ = 0.01) indicate resonant frequencies where η amplifies the MSC, potentially highlighting critical operational thresholds.
DECODING INTELLIGENCE...