## Horizontal Stacked Bar Chart: Benchmark Saturation by Category
### Overview
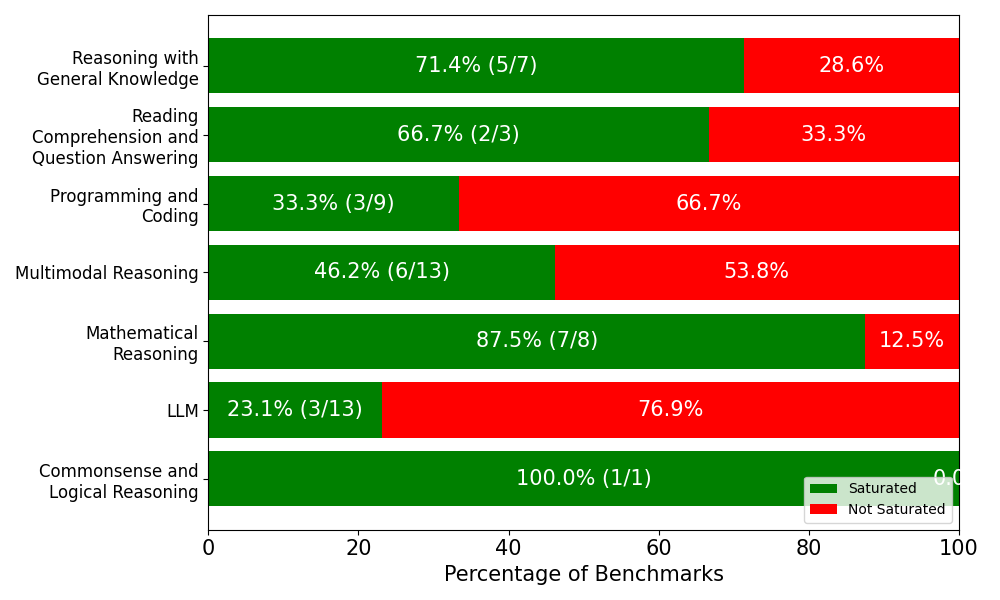
This image is a horizontal stacked bar chart illustrating the percentage of "Saturated" versus "Not Saturated" benchmarks across seven distinct cognitive and technical evaluation categories. The chart uses a green and red color scheme to visually represent the proportion of saturation within each category. The language used throughout the chart is entirely English.
### Components/Axes
**Spatial Grounding & Layout:**
* **Y-axis (Left):** Contains seven categorical labels describing different types of reasoning or tasks. The labels are right-aligned against the axis line.
* **X-axis (Bottom):** Represents the "Percentage of Benchmarks". It is scaled from 0 to 100 with major tick marks and labels at intervals of 20 (0, 20, 40, 60, 80, 100).
* **Main Chart Area (Center):** Contains seven horizontal bars corresponding to the Y-axis categories. Each bar spans the full 100% width of the X-axis, divided into green (left) and red (right) segments. Text is embedded directly inside the colored segments.
* **Legend (Bottom-Right):** Located inside the chart area, just above the 80-100 mark on the X-axis.
* **Green Square:** Labeled "Saturated"
* **Red Square:** Labeled "Not Saturated"
### Detailed Analysis
**Trend Verification & Visual Proportions:**
For every category, the visual length of the green bar (starting from 0 on the left) and the red bar (filling the remainder to 100 on the right) perfectly matches the embedded percentage text.
Below is the reconstructed data table based on the embedded text and visual proportions. The green sections include both a percentage and a fraction (representing the number of saturated benchmarks over the total benchmarks in that category). The red sections only display the remaining percentage.
| Category (Y-Axis Label) | Saturated (Green Bar) | Not Saturated (Red Bar) | Total Benchmarks (Derived) |
| :--- | :--- | :--- | :--- |
| Reasoning with General Knowledge | 71.4% (5/7) | 28.6% | 7 |
| Reading Comprehension and Question Answering | 66.7% (2/3) | 33.3% | 3 |
| Programming and Coding | 33.3% (3/9) | 66.7% | 9 |
| Multimodal Reasoning | 46.2% (6/13) | 53.8% | 13 |
| Mathematical Reasoning | 87.5% (7/8) | 12.5% | 8 |
| LLM | 23.1% (3/13) | 76.9% | 13 |
| Commonsense and Logical Reasoning | 100.0% (1/1) | 0.0%* | 1 |
*\*Note: The "0.0" text in the bottom right red section is partially cut off by the edge of the image, but is clearly inferable based on the 100.0% green section and the visible "0.0".*
### Key Observations
* **Highest Saturation:** "Commonsense and Logical Reasoning" is visually entirely green, indicating 100% saturation. However, the fraction (1/1) shows this is based on a single benchmark. "Mathematical Reasoning" follows closely at 87.5% (7/8).
* **Lowest Saturation:** The "LLM" category has the shortest green bar, showing only 23.1% saturation (3/13). "Programming and Coding" is the second lowest at 33.3% (3/9).
* **Sample Size Variance:** The fractions embedded in the green bars reveal significant variance in the number of benchmarks per category. "Multimodal Reasoning" and "LLM" have the highest number of total benchmarks (13 each), while "Commonsense and Logical Reasoning" has only 1.
* **Total Benchmarks:** By summing the denominators of the fractions, we can determine that this chart represents a total of 54 individual benchmarks across all categories.
### Interpretation
**What the data suggests:**
In the context of AI and machine learning evaluation, a "saturated" benchmark typically refers to a test where current models have achieved near-perfect or human-level performance, rendering the benchmark obsolete for measuring future progress.
This chart demonstrates that traditional, well-defined domains like "Mathematical Reasoning" (87.5%) and "Reasoning with General Knowledge" (71.4%) are highly saturated. The AI community has largely "solved" the specific tests currently used in these categories.
Conversely, categories like "LLM" (23.1%), "Programming and Coding" (33.3%), and "Multimodal Reasoning" (46.2%) are largely *not* saturated. This indicates that these are the current frontiers of AI research; the existing benchmarks in these categories are still challenging enough to effectively measure and differentiate the capabilities of newer models.
**Reading between the lines (Peircean Analysis):**
The most critical piece of information in this chart is not the percentages, but the *fractions*. Presenting "Commonsense and Logical Reasoning" as 100% saturated is statistically misleading without the context of the (1/1) fraction. It doesn't mean AI has mastered all commonsense; it means AI has mastered the *single* benchmark this specific study chose to include.
Furthermore, the categories with the most benchmarks (LLM and Multimodal, with 13 each) have the lowest saturation. This suggests a correlation: as a field becomes more complex and less saturated, researchers create a higher volume of diverse benchmarks to try and capture the nuances of model performance. The chart effectively highlights the urgent need for the AI community to develop new, harder benchmarks for Mathematics and General Knowledge, as the current ones are no longer useful discriminators of model capability.