## Horizontal Bar Chart: Benchmark Saturation
### Overview
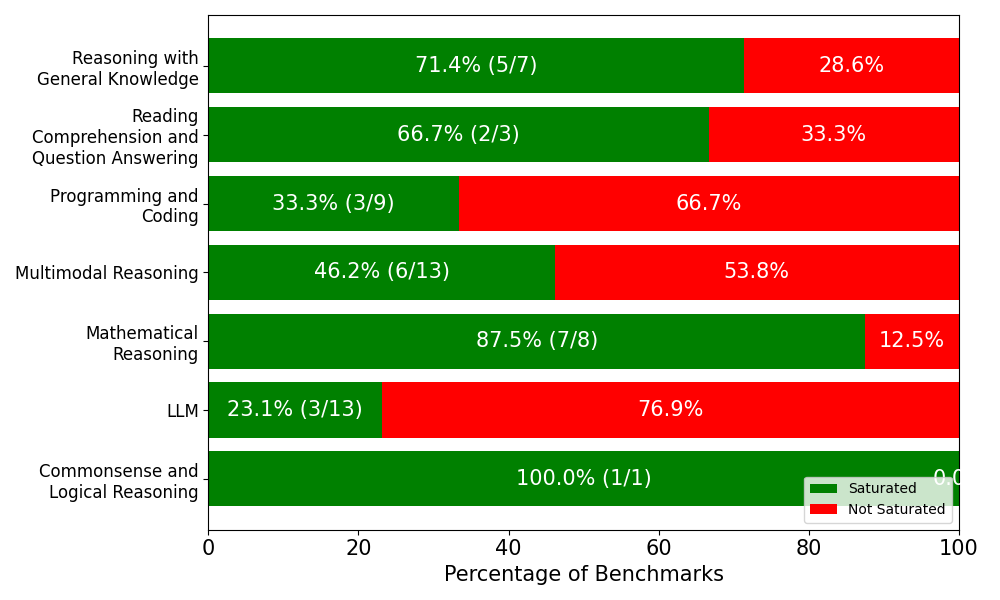
The image is a horizontal bar chart comparing the performance of a system across different reasoning and knowledge domains. Each bar represents a specific category, and the bar is divided into two colored segments: green ("Saturated") and red ("Not Saturated"). The chart displays the percentage and the fraction of benchmarks achieved for each category.
### Components/Axes
* **Y-axis:** Lists the categories being evaluated. From top to bottom:
* Reasoning with General Knowledge
* Reading Comprehension and Question Answering
* Programming and Coding
* Multimodal Reasoning
* Mathematical Reasoning
* LLM
* Commonsense and Logical Reasoning
* **X-axis:** Represents the "Percentage of Benchmarks," ranging from 0% to 100% in increments of 20%.
* **Legend:** Located in the bottom-right corner, indicating:
* Green: "Saturated"
* Red: "Not Saturated"
### Detailed Analysis
Here's a breakdown of each category's performance, including the trend and specific values:
* **Reasoning with General Knowledge:**
* Trend: Predominantly Saturated.
* Saturated (Green): 71.4% (5/7)
* Not Saturated (Red): 28.6%
* **Reading Comprehension and Question Answering:**
* Trend: Predominantly Saturated.
* Saturated (Green): 66.7% (2/3)
* Not Saturated (Red): 33.3%
* **Programming and Coding:**
* Trend: Predominantly Not Saturated.
* Saturated (Green): 33.3% (3/9)
* Not Saturated (Red): 66.7%
* **Multimodal Reasoning:**
* Trend: Slightly more Not Saturated than Saturated.
* Saturated (Green): 46.2% (6/13)
* Not Saturated (Red): 53.8%
* **Mathematical Reasoning:**
* Trend: Highly Saturated.
* Saturated (Green): 87.5% (7/8)
* Not Saturated (Red): 12.5%
* **LLM:**
* Trend: Overwhelmingly Not Saturated.
* Saturated (Green): 23.1% (3/13)
* Not Saturated (Red): 76.9%
* **Commonsense and Logical Reasoning:**
* Trend: Completely Saturated.
* Saturated (Green): 100.0% (1/1)
* Not Saturated (Red): 0.0%
### Key Observations
* Commonsense and Logical Reasoning is the only category with 100% saturation.
* LLM has the lowest saturation rate, with only 23.1% of benchmarks saturated.
* Mathematical Reasoning shows a high saturation rate of 87.5%.
* Programming and Coding and Multimodal Reasoning have more benchmarks not saturated than saturated.
### Interpretation
The chart provides a performance overview across different reasoning and knowledge areas. The "Saturated" vs. "Not Saturated" distinction likely indicates whether the system met a certain performance threshold or achieved a desired outcome for each benchmark.
The high saturation in Commonsense and Logical Reasoning suggests strong performance in this area. Conversely, the low saturation in LLM indicates a potential weakness or area for improvement. The varying degrees of saturation across the other categories highlight the system's strengths and weaknesses in different domains. The data suggests that the system performs well in areas requiring established logical rules and mathematical principles, but struggles with more complex tasks like programming and coding, and especially LLM tasks.