\n
## Horizontal Bar Chart: LLM Benchmark Saturation
### Overview
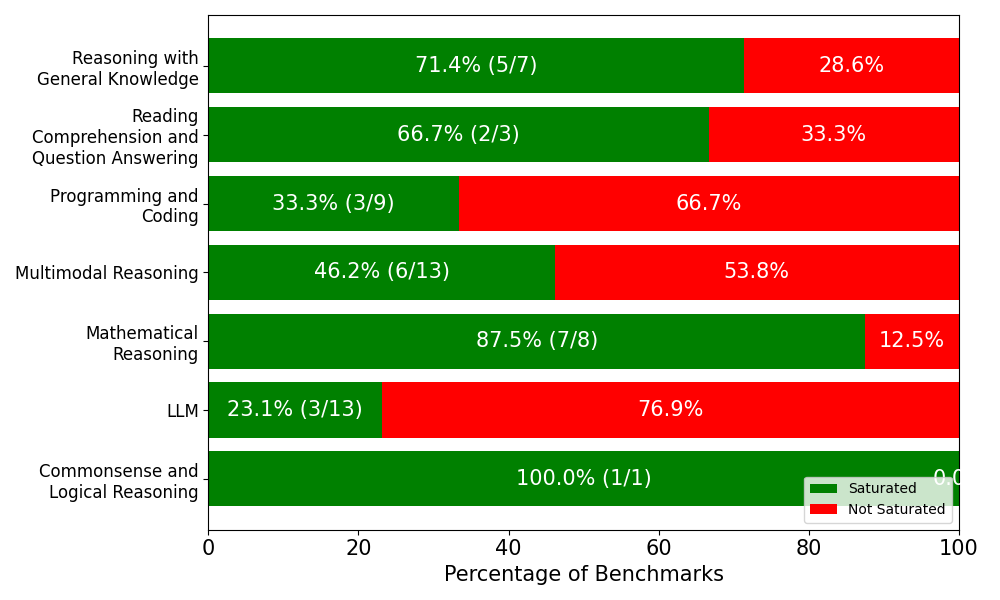
This is a horizontal bar chart visualizing the percentage of benchmarks saturated by a Large Language Model (LLM) across various reasoning categories. Each bar represents a category, with the green portion indicating the percentage of saturated benchmarks and the red portion indicating the percentage of non-saturated benchmarks. The number of saturated benchmarks out of the total number of benchmarks for each category is also displayed.
### Components/Axes
* **Y-axis (Vertical):** Represents the different reasoning categories:
* Reasoning with General Knowledge
* Reading Comprehension and Question Answering
* Programming and Coding
* Multimodal Reasoning
* Mathematical Reasoning
* LLM
* Commonsense and Logical Reasoning
* **X-axis (Horizontal):** Represents the "Percentage of Benchmarks", ranging from 0 to 100.
* **Legend (Bottom-Right):**
* Green: "Saturated"
* Red: "Not Saturated"
* **Data Labels:** Each bar includes a percentage value (e.g., 71.4%, 28.6%) and a fraction representing (Saturated Benchmarks / Total Benchmarks) (e.g., (5/7), (2/3)).
### Detailed Analysis
Here's a breakdown of each category's saturation levels:
1. **Reasoning with General Knowledge:** 71.4% Saturated (5/7). The bar is predominantly green, with a smaller red portion.
2. **Reading Comprehension and Question Answering:** 66.7% Saturated (2/3). Approximately two-thirds of the bar is green.
3. **Programming and Coding:** 33.3% Saturated (3/9). The bar is predominantly red, with a smaller green portion.
4. **Multimodal Reasoning:** 46.2% Saturated (6/13). The bar is roughly half green and half red.
5. **Mathematical Reasoning:** 87.5% Saturated (7/8). The bar is overwhelmingly green, with a very small red portion.
6. **LLM:** 23.1% Saturated (3/13). The bar is predominantly red, with a small green portion.
7. **Commonsense and Logical Reasoning:** 100.0% Saturated (1/1). The bar is entirely green.
### Key Observations
* **Highest Saturation:** Commonsense and Logical Reasoning shows 100% saturation, indicating the LLM performs very well on this type of benchmark.
* **Lowest Saturation:** LLM category shows the lowest saturation at 23.1%.
* **Significant Variation:** There's a wide range in saturation levels across different reasoning categories, from 23.1% to 100%.
* **Mathematical Reasoning is High:** Mathematical Reasoning is also highly saturated at 87.5%.
* **Programming and Coding is Low:** Programming and Coding is relatively low at 33.3%.
### Interpretation
The chart demonstrates the varying capabilities of the LLM across different reasoning tasks. The LLM excels at Commonsense and Logical Reasoning and Mathematical Reasoning, achieving near-complete saturation of benchmarks in these areas. However, it struggles with Programming and Coding and the LLM category itself, indicating areas where further development is needed. The saturation percentages provide a quantitative measure of the LLM's performance on each type of benchmark, and the (Saturated/Total) ratios offer insight into the sample size used for each category. The differences in saturation levels suggest that the LLM's architecture or training data may be better suited for certain types of reasoning than others. The relatively low saturation in Programming and Coding could indicate a need for more specialized training data or architectural modifications to improve performance in this domain. The low saturation in the LLM category itself is curious and may indicate the benchmarks used to evaluate the LLM are particularly challenging or are designed to expose weaknesses in the model's core capabilities.