# Technical Document Extraction: Benchmark Performance Analysis
## Chart Overview
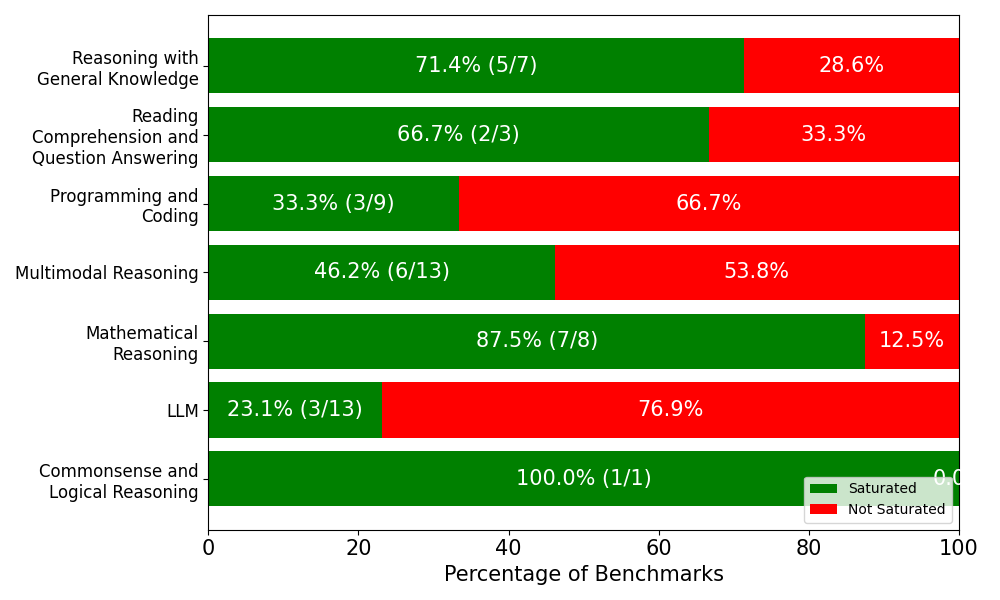
Horizontal bar chart comparing performance metrics across multiple reasoning domains. Color-coded representation of saturated vs. non-saturated benchmarks.
### Legend
- **Green**: Saturated (✓)
- **Red**: Not Saturated (✗)
- **Placement**: Bottom-right quadrant
### Axis Configuration
- **X-axis**: Percentage of Benchmarks (0-100%)
- Increment markers: 0, 20, 40, 60, 80, 100
- **Y-axis**: Categorical domains (7 total)
- Ordered top-to-bottom:
1. Reasoning with General Knowledge
2. Reading Comprehension and Question Answering
3. Programming and Coding
4. Multimodal Reasoning
5. Mathematical Reasoning
6. LLM
7. Commonsense and Logical Reasoning
## Data Analysis
### Key Trends
1. **Mathematical Reasoning** shows highest saturation (87.5%)
2. **LLM** demonstrates lowest saturation (23.1%)
3. **Commonsense and Logical Reasoning** achieves perfect saturation (100%)
### Category Breakdown
| Category | Saturated (%) | Saturated (Count) | Not Saturated (%) | Not Saturated (Count) |
|-----------------------------------|---------------|-------------------|-------------------|-----------------------|
| Reasoning with General Knowledge | 71.4 | 5/7 | 28.6 | - |
| Reading Comprehension | 66.7 | 2/3 | 33.3 | - |
| Programming and Coding | 33.3 | 3/9 | 66.7 | - |
| Multimodal Reasoning | 46.2 | 6/13 | 53.8 | - |
| Mathematical Reasoning | 87.5 | 7/8 | 12.5 | - |
| LLM | 23.1 | 3/13 | 76.9 | - |
| Commonsense and Logical Reasoning | 100.0 | 1/1 | 0.0 | - |
## Spatial Grounding
- **Legend Position**: [x: 85-100, y: 0.9] (bottom-right)
- **Bar Orientation**: Horizontal (left-to-right growth)
- **Color Consistency**:
- Green bars always represent saturated benchmarks
- Red bars always represent non-saturated benchmarks
## Trend Verification
1. **Mathematical Reasoning**: Green bar dominates (87.5%) vs red (12.5%)
2. **LLM**: Red bar significantly longer (76.9%) vs green (23.1%)
3. **Commonsense**: Perfect green saturation (100%)
## Component Isolation
1. **Header**: Chart title (implied by axis labels)
2. **Main Chart**:
- 7 horizontal bars with dual-color segmentation
- Percentage markers at 20% intervals
3. **Footer**:
- Legend with color coding
- X-axis percentage scale
## Data Table Reconstruction
| Category | Saturated (%) | Saturated (Count) | Not Saturated (%) | Not Saturated (Count) |
|-----------------------------------|---------------|-------------------|-------------------|-----------------------|
| Reasoning with General Knowledge | 71.4 | 5/7 | 28.6 | - |
| Reading Comprehension | 66.7 | 2/3 | 33.3 | - |
| Programming and Coding | 33.3 | 3/9 | 66.7 | - |
| Multimodal Reasoning | 46.2 | 6/13 | 53.8 | - |
| Mathematical Reasoning | 87.5 | 7/8 | 12.5 | - |
| LLM | 23.1 | 3/13 | 76.9 | - |
| Commonsense and Logical Reasoning | 100.0 | 1/1 | 0.0 | - |
## Critical Observations
1. **Highest Performance**: Mathematical Reasoning (87.5% saturation)
2. **Lowest Performance**: LLM (23.1% saturation)
3. **Perfect Score**: Commonsense and Logical Reasoning (100% saturation)
4. **Balanced Performance**: Reading Comprehension (66.7% saturation)
## Language Note
All textual content is in English. No non-English elements detected.