## Density Plot: Image-Text Pairs vs. Text-Text Pairs
### Overview
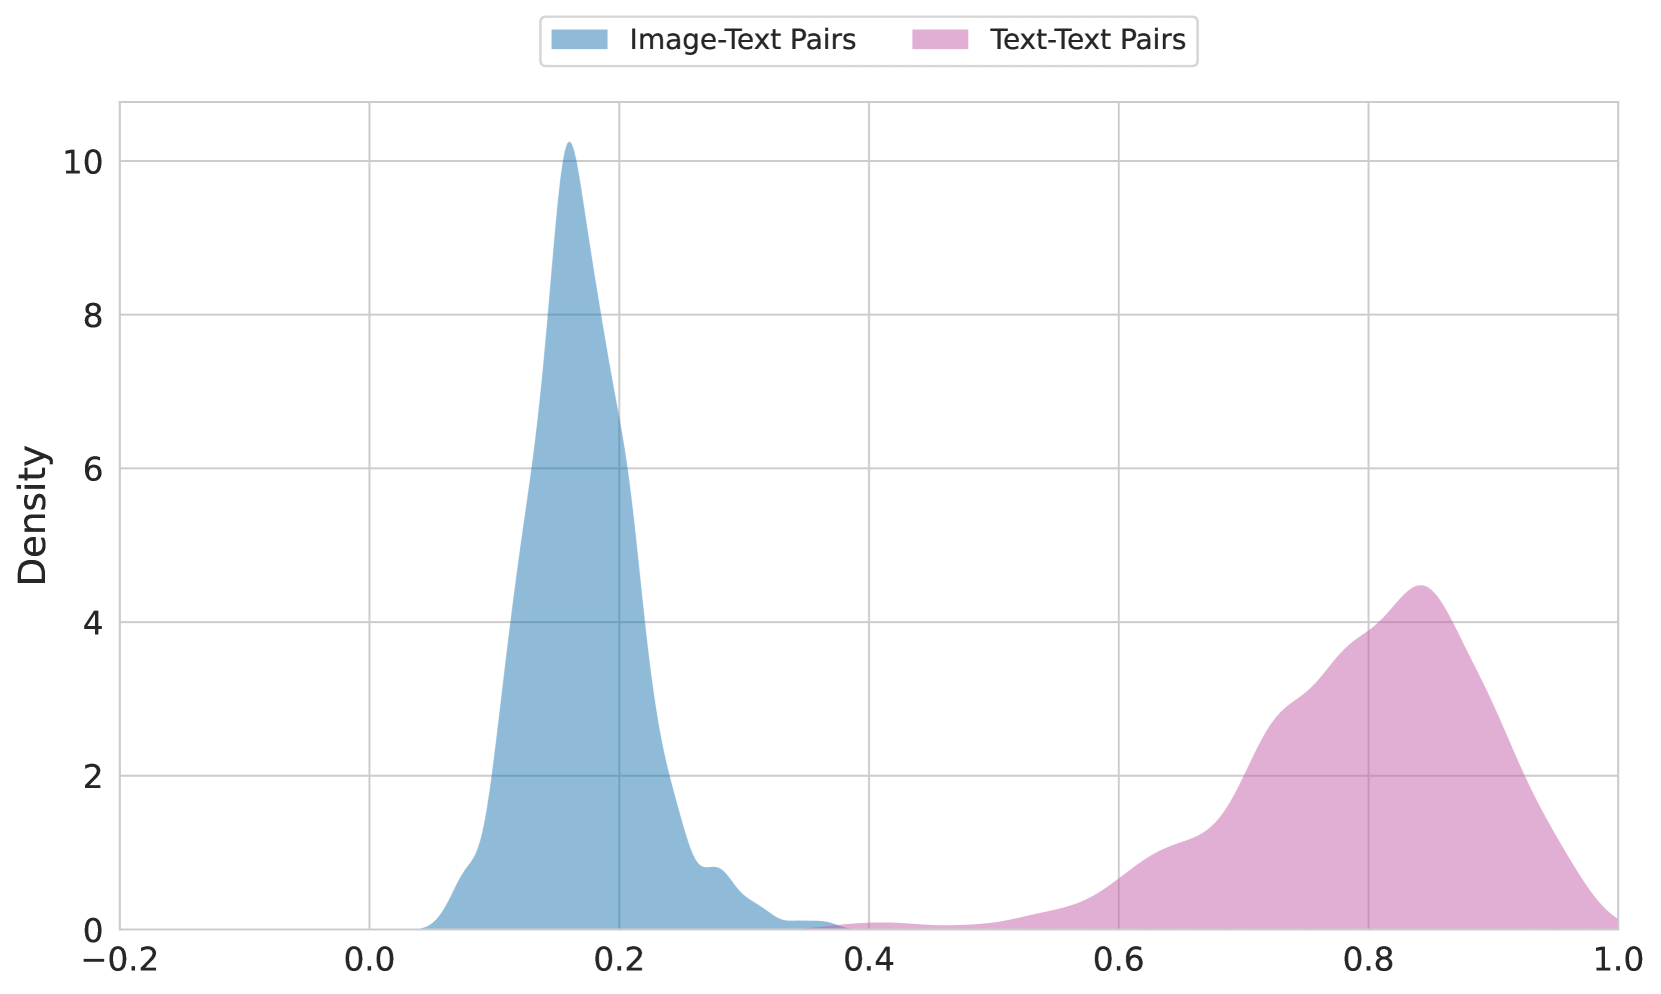
The image is a density plot comparing the distribution of "Image-Text Pairs" and "Text-Text Pairs." The plot shows the density of each type of pair along the y-axis, with values ranging from 0 to 10. The x-axis represents an unspecified metric, ranging from -0.2 to 1.0. The "Image-Text Pairs" distribution is represented by a blue curve, while the "Text-Text Pairs" distribution is represented by a pink curve.
### Components/Axes
* **X-axis:** Ranges from -0.2 to 1.0, with tick marks at -0.2, 0.0, 0.2, 0.4, 0.6, 0.8, and 1.0. The x-axis label is not explicitly provided in the image.
* **Y-axis:** Labeled "Density," ranging from 0 to 10, with tick marks at intervals of 2.
* **Legend:** Located at the top of the chart.
* Blue: "Image-Text Pairs"
* Pink: "Text-Text Pairs"
### Detailed Analysis
* **Image-Text Pairs (Blue):**
* The distribution is heavily skewed to the right, with a peak around x = 0.15.
* The density rises sharply from x = -0.2 to x = 0.15, reaching a peak density of approximately 10.2.
* The density then decreases rapidly from x = 0.15 to x = 0.4, approaching 0.
* From x = 0.4 to x = 1.0, the density remains close to 0.
* **Text-Text Pairs (Pink):**
* The distribution is skewed to the left, with a peak around x = 0.8.
* The density is close to 0 from x = -0.2 to x = 0.6.
* The density rises from x = 0.6 to x = 0.8, reaching a peak density of approximately 4.5.
* The density decreases from x = 0.8 to x = 1.0, approaching 0.
### Key Observations
* The "Image-Text Pairs" have a much higher density peak than the "Text-Text Pairs" (approximately 10.2 vs. 4.5).
* The "Image-Text Pairs" are concentrated at lower x-axis values, while the "Text-Text Pairs" are concentrated at higher x-axis values.
* There is minimal overlap between the two distributions.
### Interpretation
The density plot suggests that "Image-Text Pairs" and "Text-Text Pairs" represent distinct populations with different characteristics along the x-axis metric. The "Image-Text Pairs" are more frequent at lower values of the metric, while "Text-Text Pairs" are more frequent at higher values. The nature of the x-axis metric is not specified, but the plot indicates a clear separation between the two types of pairs based on this metric. The higher density of "Image-Text Pairs" at its peak suggests that this type of pair is more common or has a stronger association with the lower end of the x-axis metric compared to "Text-Text Pairs" at the higher end.