## Density Plot: Image-Text Pairs vs. Text-Text Pairs
### Overview
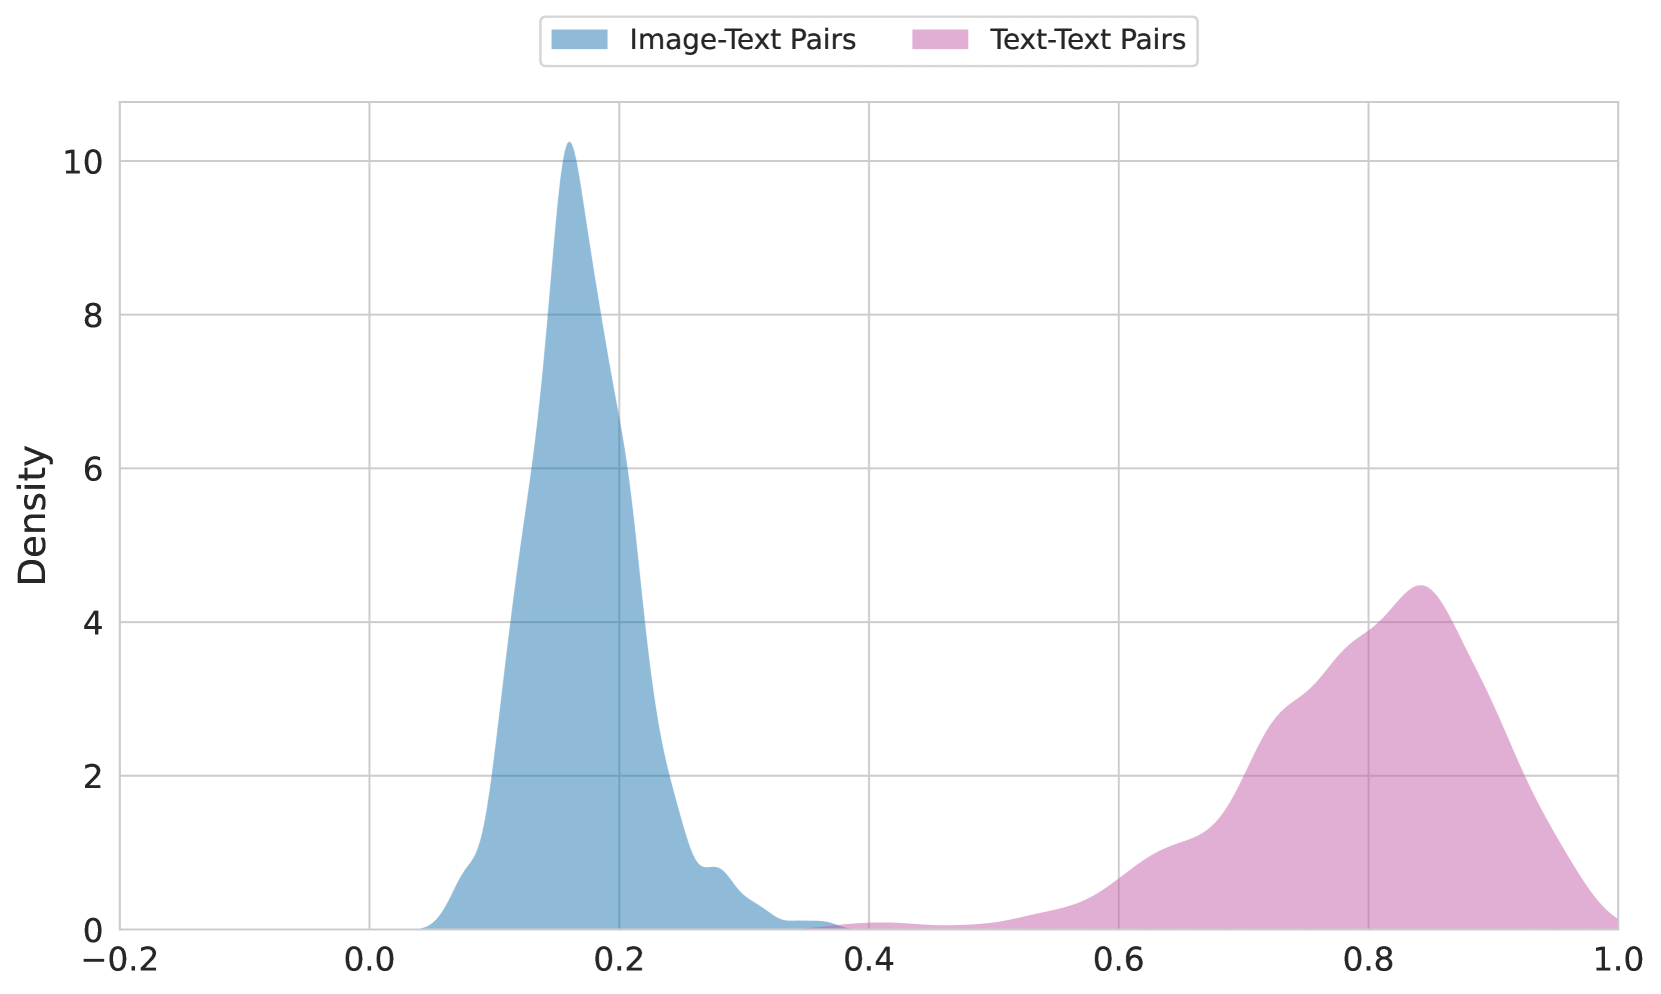
The image displays a density plot comparing two sets of data: Image-Text Pairs and Text-Text Pairs. The plot is divided into two distinct regions, each representing a different category of data.
### Components/Axes
- **X-axis**: Represents the values of the data, ranging from -0.2 to 1.0.
- **Y-axis**: Represents the density of the data, with values ranging from 0 to 10.
- **Legend**: Located at the top right corner, indicating the two categories of data: Image-Text Pairs (blue) and Text-Text Pairs (pink).
### Detailed Analysis or ### Content Details
- **Image-Text Pairs**: The blue region of the plot shows a high density of data points around the value of 0.2. This suggests that a significant number of Image-Text Pairs have a value close to 0.2.
- **Text-Text Pairs**: The pink region of the plot shows a lower density of data points, with a peak around the value of 0.6. This indicates that fewer Text-Text Pairs have a value close to 0.6 compared to Image-Text Pairs.
### Key Observations
- The Image-Text Pairs have a higher density of data points around the value of 0.2, suggesting a concentration of these pairs in this region.
- The Text-Text Pairs have a lower density of data points, with a peak around the value of 0.6, indicating a more spread-out distribution of these pairs.
### Interpretation
The density plot suggests that there is a significant difference in the distribution of Image-Text Pairs and Text-Text Pairs. The higher density of Image-Text Pairs around the value of 0.2 could indicate a concentration of these pairs in this region, possibly due to a specific characteristic or condition that is more prevalent in this area. On the other hand, the lower density of Text-Text Pairs around the value of 0.6 could indicate that fewer Text-Text Pairs have this characteristic or condition, or that the distribution is more spread out in this region.
In terms of interpretation, the data suggests that there is a difference in the characteristics or conditions of Image-Text Pairs and Text-Text Pairs. The higher density of Image-Text Pairs around the value of 0.2 could indicate that these pairs have a specific characteristic or condition that is more prevalent in this region, while the lower density of Text-Text Pairs around the value of 0.6 could indicate that fewer Text-Text Pairs have this characteristic or condition, or that the distribution is more spread out in this region.